Ramesh Kumar Pandey, Mahipal Singh Sankhla, Rajeev Kumar
Galgotias University, India
Correspondence: Mahipal Singh Sankhla, Research Scholar, Division of Forensic Science, SBAS, Galgotias University, Greater Noida, India
Received: July 31, 2018 | Published: August 31, 2018
Citation: Pandey RK, Sankhla MS, Kumar R. Determination of adulterants in suspected liquor samples using chemical tests. MOJ Toxicol. 2018;4(4):309–314. DOI: 10.15406/mojt.2018.04.00118
Abstract
The term alcohol, used as a proper name, is applied both to the absolute substance farther specified by chemists as ethyl alcohol, and to its mixtures with smaller proportions of water and slight proportions of other substances. In chemistry, the word alcohol is used as a common or generic name to designate several series of substances. Alcohol consumption has existed in India for many centuries. The quantity pattern of used and resultant problems have undergone substantial changes over the past twenty years. This category, created for revenue purposes, consists in western- style distilled beverages such as whisky, rum, gin. These are made in India under government license and the maximum alcohol content allowed is 42.8%. Besides licensed distilleries, a number of small production units operate clandestinely. The raw materials they used are similar to those in country liquor, but since they evade legal quality controls the alcohol concentration in their products varies and adulteration is frequent. It is common to rum, whisky and gin find samples containing up to 56% alcohol. The hazardous adulterant is industrial methylated sprit which irregularly cause mass toxicity of humans who lose their lives or suffer irreversible eye damage. Since no government revenues are paid, illicit liquor is considerably less expensive then license country liquor, and thus finds a ready market among the poor.
Keywords: alcohol, illicit, toxicity, adulteration
Introduction
Describes a simple, fast method of proving identity or brand on the basis of anion composition. This will enable the testing of suspicions that arise during food control. Spirits are reduced to bottling strength with water from rectified distillates. The ionic content of the water and brand-specific water additives used give rise to differences in the ionic composition of the product. The simple, cost-saving, and reliable method of ion chromatography, which is already approved in water analysis, can therefore be used for the determination of anions in spirits. The Selected decreases the organoleptic features of the raw resources. Flavouring may be added to give the product special organoleptic characteristics, such as a mellow taste.1 According to Karnataka Excise Rules (1997), the ethanol content of whisky, rum and gin (IMFL) are mandated at 42.8% volume by volume (75° proof) and of country liquor or arrack at 33.3% volume by volume (65° proof) at 15/15°C. The Karnataka Excise Act specifies that for the manufacture of IMFL and arrack, the basic material is Rectified spirit [manufactured by distillation of molasses] of not less than 166° proof. Such spirit has to be reduced to strengths of 75° proof or 65° proof depending on whether IMFL or arrack is the final product.2 The authenticity of cognacs, whiskies, rums and similar strong alcoholic beverages can be verified by determining the concentrations of ethanol and the following congeners in the product: methanol, higher alcohols and ethyl acetate. These values are then compared with a database of reference samples. Data from quantitative measurement can be processed statistically using principal component analysis (PCA) based on clustering techniques. PCA is a useful method when the data contain large numbers of variables. PCA yields a small body of new variables that incorporate most of the information in the original variables, facilitating the perception of complicated matrices. Such a work-up is presented by with various brands of whiskies being classified into groups by chemical analysis and PCA. Developed a complex, multi-method analysis for brand identification using statistical processing on the basis of chemical composition, ultraviolet absorption, and pH.3 According to Bureau of Indian Standards (1986), the ethanol content of whisky, rum and gin (IMFL) are mandated at 42.8% volume by volume (75° proof) and of country liquor or arrack at 33.3% volume by volume (65° proof) at 15/15°C. The Bureau of Indian Standards specifies that for the manufacture of IMFL and arrack, the basic material is Rectified spirit (manufactured by distillation of molasses) of not less than166 proof. The ingestion of drinks with the nonqualified raw materials containing high levels of adulterants can cause serious health difficulties like metabolic problems, blindness, permanent neurological damage or even death.4 Suggested about traditionally colorless, extract-free spirits (e.g. vodka and white rum) are identified by the detection of volatile substances using gas chromatography (GC).5 The raw spirit put through rectification is usually produced from grain (rye and wheat) and potatoes. In vodka production, the quality of water is of the utmost importance. For premium vodka brands, demineralized water is filtered through activated carbon to absorb unwanted organic and inorganic materials. Then it is passed through deionization columns, which remove other impurities present. The rectified spirit and demineralized water are blended in the correct proportions. The blended spirit is charcoaled for up to 8 h. The charcoal adsorbs impurities that cannot be removed by distillation alone. The vodka is then reduced to its bottling strength by adding further demineralised water.6
Materials and methods
Determination of ethyl alcohol by volume
Two methods have been prescribed in BIS, namely, method I {Hydrometer method (2302-1962)}, method II {Pyknometer method}. In which method I be used as routine method, whereas Method II as referee method.
Procedure: 200ml of sample were taken in a 500ml. distillation flask containing to it about 25ml. of distilled water and a few pieces of pumice stone {a very light porous rock formed from solidified lava, used in solid form as an abrasive and in powdered form as a polish} was added. And the distillation setup is allowed to heat over thermostat, the distillate is collected in a 200ml. measuring flask. The distillate is allowed to cool at the room temperature; the volume was makeup to 200ml. using distilled water and mixed thoroughly. The specific gravity of the distillate at the required temperature was measured with the help of a hydrometer (routine test) and Pyknometer (referee test). The readings were recorded and compared with the standard value as prescribed in the tables of Alcoholometry.4
Determination of suspended solids
Procedure: The contents of the container were mixed thoroughly by shaking it. 250ml. of it were taken and filtered through a dry tared filter paper. The filter paper was dried over the hot air oven at 110o±2oC. After cooling the sample is weighed. And the results were calculated and expressed to four decimal places.
Determination of esters as ethyl acetate
Procedure: To the neutralized distillate from the volatile acidity determination, 10ml. of standard alkali solution was added and refluxed it on a stream bath for an hour. The sample was cooled and back titrated, the excess of alkali with standard sulphuric acid (1ml. of standard alkali is equivalent to 0.0088gm. of acetate). A blank taking 50ml. of distilled in place of the distillate of the sample is run simultaneously in the same way. The difference in titration value in ml. of standard acid solution gives the equivalent ester.4
Determination of higher alcohols
Three methods have been prescribed in BIS, namely, method I (Komarowski method), Method II. Method I may be used to determine approximately the quantity of higher alcohols in process control. Method II shall be employed for accurate determination while method III shall be used as reference method.4
Method I (Komarowski method)
Procedure: A clean glass–stoppered bottle was taken and washed it twice with the spirit to be tested. Similarly, a small cylinder or a 100ml pipette was washed. 10ml. of sprit were taken in the bottle and to it 1ml. of 1% salicylic aldehyde and 20ml. of conc. Sulphuric acid were added. The mixture was allowed to stand at room temperature for over 12hours. The change in colour was noted and compared with the colour developed after the reaction indicates the amount of higher alcohol as follows:
Colour Amount of higher alcohol
- Light yellow only traces
- Yellow to Brown About 0.1% (v/v)
- Brown About 0.2% (v/v)
- Red About 0.5 to 1.0 % (v/v)
- Dark red to Black About 0.5 to 1.0% (v/v)
Method II
Procedure: 50ml. of water was added to the solution resulting from the determination of esters and solution is extracted four times with carbon tetrachloride using 40, 30, 20 and 10ml. respectively. The extracts were washed three times with saturated sodium chloride solution and twice with saturated Sodium Sulphate solution. Carbon tetrachloride was filtered out and to it 50ml. of oxidizing mixture was added and refluxed for two hours. The solution was cooled and the reflux condenser was washed with 50ml. of water and transferred it to the distillation flask using50 ml. of water. Distil till about 50ml. is left over the flask. Avoid charring. The distillate is titrated against standard alkali, using phenolphthalein as indicator (1ml. of standard alkali is equivalent to 0. 0088gm. of amyl alcohol.) Run a blank in the same way taking 100ml. of distilled water in place of the distillate of the liquor.
Determination of ash
Procedure: The contents of the container were shaken and evaporated, 100ml. of the sample is on dried, tared dish over water bath. The dish was placed in a muffle furnace maintained at 450o to 500oC for the about an hour. The dish was Cooled in a desiccator and weighed, the results were expressed to four decimal places.4
Determination of copper
Potassium ferrocyanide method
Procedure: Transfer 20ml. of the material into a silica evaporating dish and add 1ml. of dilute sulphuric acid. Heat gently in the beginning and the evaporate almost to dryness on a water bath. Ignite the residue over a smokeless flame to eliminate sulphuric acid. Cool, dissolve the residue in 2ml. of water, add three drops of aqua regia and evaporate to dryness on the water bath. Dissolve the residue in 2ml. of hydrochloric acid and warm gently the residue is dissolved. Add 0.5gm. of ammonium chloride and dilute with 15ml. of water distill in an all glass apparatus. Add dilute ammonium hydroxide as alkaline. Boil off excess of ammonia and filter into a clean Nessler tube. Cool and then render to the solution acidic with acetic acid (3 to 5 drops are usually sufficient). Dilute to 40ml. Add 0.5ml. of potassium ferrocyanide solution, stir and make up the volume to 50ml. {Note: – If the copper is more, a lesser amount of the material may be taken for the test.} Prepare a series of control solutions each containing in 50ml. 0.5gm. of ammonium chloride, 3 to 5 drops of acetic acid and 0.5ml. potassium ferrocyanide solution together with an increase amount of copper, namely 2, 4, 6, 8, and 10ml. of the standard copper solution Compare the test solution with control solutions and note the number of ml. of standard copper solution added in the control solution having, as nearly as possible, the same intensity of color as that of the test solution.4
Result and discussion
These research work was carried out at the India Brewery and Distillery Ltd, Bidar, Karnataka, India. Check the specification of liquors. In the study Qualitative analysis for the presences of illicit content like Copper, Ash, Ethyl Alcohol, Higher Alcohol Content, Acetaldehyde and Fixed Acidity present in the liquor sample were done by using the presumptive colour tests and the results are reported. Content in the samples were analyzed qualitatively and quantitatively for determination of the strength of the liquor sample and results are reported in tables and figures. The quantitative determination of the contents liquors were examined by the prescribed methods of the BIS (3752-1956) guidelines to check their quantity in the suspected liquors as in illicit liquor there me be increased quantity of these contents shown table 1-12 and figure 1-12. These results reported here shows that the suspected liquor shows the presence of illicit components like Copper, Ash, Ethyl Alcohol, Higher Alcohol Content, Acetaldehyde and Fixed Acidity. The quantitative analysis of the suspected and standard samples showed that the contents of standard liquors are within permissible limit of the BIS however the suspected liquor samples showed the exceed limit of these contents.
Estimation of ethyl alcohol (v/v)
The Table 1 and Figure 1 shows the Ethyl alcohol percentage in standard Liquor sample as reported in Whisky, Rum and Gin were found to be under the permissible limits described by BIS. However Table 2 and Figure 2, shows the exceed limit of ethyl alcohol content in the suspected samples of Whisky, Rum and Gin.
| Brands | Sample 1 | Sample 2 | Sample 3 |
| Whisky | 42.6 % v/v | 42.7% v/v | 42.6% v/v |
| Rum | 42.9% v/v | 42.7% v/v | 42.7% v/v |
| Gin | 42.4% v/v | 42.6% v/v | 42.6% v/v |
Table 1 Estimation of Ethyl alcohol (%) in standard Whisky, Rum and Gin sample
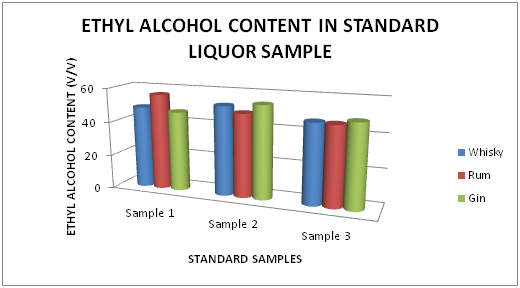
Figure 1 Estimation of Ethyl alcohol (%) in standard Whisky, Rum and Gin sample.
| Brands | Sample 1 | Sample 2 | Sample 3 |
| Whisky | 48.4% v/v | 36.5% v/v | 34.4% v/v |
| Rum | 56.4% v/v | 48.8% v/v | 46.4% v/v |
| Gin | 46.8% v/v | 54.4% v/v | 48.6% v/v |
Table 2 Estimation of Ethyl alcohol (%) in suspected Whisky, Rum and Gin sample
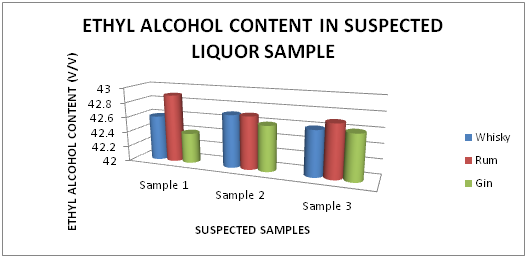
Figure 2 Estimation of Ethyl alcohol (%) in suspected Whisky, Rum and Gin sample.
Estimation of ash (%)
The Table 3 and Figure 3, showing the Ash percentage in standard Liquor sample as reported in Whisky, Rum and Gin were found to be under the permissible limits described by BIS. However, Table 4 and Figure 4, shows the exceed limit of Ash percentage in the suspected samples of Whisky, Rum and Gin.
| Brands | Sample 1 | Sample 2 | Sample 3 |
| Whisky | 0.01 | 0.018 | 0.017 |
| Rum | 0.018 | 0.016 | 0.018 |
| Gin | 0.019 | 0.018 | 0.015 |
Table 3 Estimation of Ash (%) in Standard Whisky, Rum and Gin samples
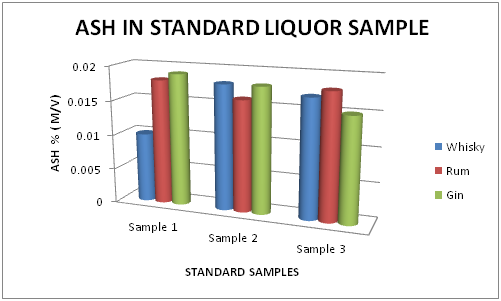
Figure 3 Estimation of Ash (%) in standard Whisky, Rum and Gin samples.
| Brands | Sample 1 | Sample 2 | Sample 3 |
| Whisky | 0.10 | 0.10 | 0.15 |
| Rum | 0.15 | 0.15 | 0.20 |
| Gin | 0.9 | 0.6 | 0.6 |
Table 4 Estimation of Ash (%) in Suspected Whisky, Rum and Gin samples
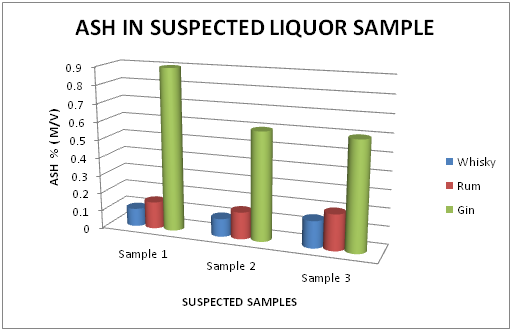
Figure 4 Estimation of Ash (%) in suspected Whisky, Rum and Gin samples.
Estimation of higher alcohol content
The Table 5 and Figure 5 showing the Higher Alcohol present in standard Liquor sample as reported in Whisky, Rum and Gin were found to be under the permissible limits described by BIS. However, Table 6 and Figure 6, shows the exceed limit of Higher Alcohol in the suspected samples of Whisky, Rum and Gin.
| Brands | Sample 1 | Sample 2 | Sample 3 |
| Whisky | 2.00 | 2.50 | 2.00 |
| Rum | 1.50 | 2.00 | 1.50 |
| Gin | 4.20 | 4.00 | 4.20 |
Table 5 Estimation of Higher Alcohol in Standard Whisky, Rum and Gin samples
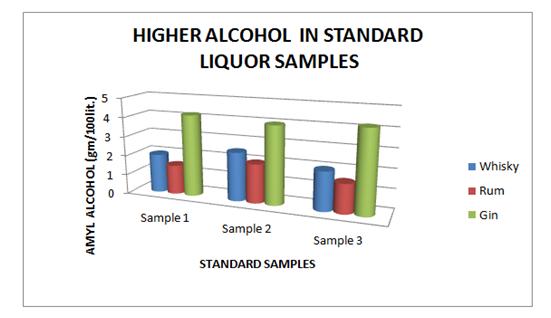
Figure 5 Estimation of higher alcohol in Standard Whisky, Rum and Gin samples.
| Brands | Sample 1 | Sample 2 | Sample 3 |
| Whisky | 3.50 | 3.80 | 3.80 |
| Rum | 3.80 | 3.60 | 3.80 |
| Gin | 5.00 | 4.80 | 4.80 |
Table 6 Estimation of Higher Alcohol in Suspected Whisky, Rum and Gin samples
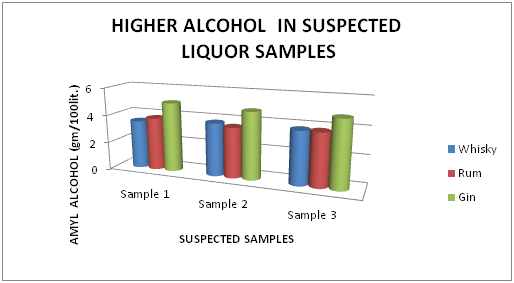
Figure 6 Estimation of higher alcohol in Suspected Whisky, Rum and Gin samples.
Estimation of acetaldehyde
The Table 7 and Figure 7, showing the Acetaldehyde present in standard Liquor sample as reported in Whisky, Rum and Gin were found to be under the permissible limits described by BIS. However, Table 8 and Figure 8, shows the exceed limit of Acetaldehyde in the suspected samples of Whisky, Rum and Gin.
| Brands | Sample 1 | Sample 2 | Sample 3 |
| Whisky | 4.2 | 4.4 | 4.2 |
| Rum | 4.18 | 4.16 | 4.18 |
| Gin | 0.18 | 0.16 | 0.18 |
Table 7 Estimation of Acetaldehyde in Standard Whisky, Rum and Gin samples
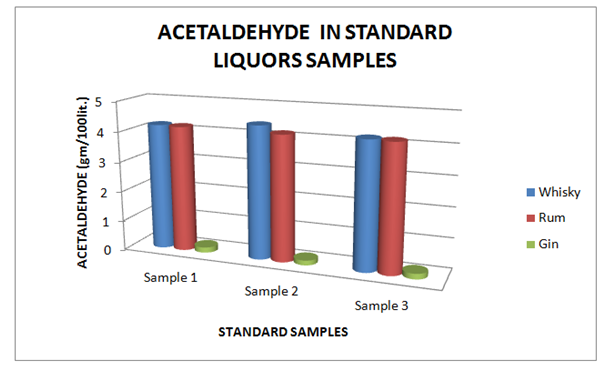
Figure 7 Estimation of Acetaldehyde in Standard Whisky, Rum and Gin samples.
| Brands | Sample 1 | Sample 2 | Sample 3 |
| Whisky | 4.80 | 4.60 | 4.60 |
| Rum | 5.0 | 5.20 | 5.10 |
| Gin | 0.40 | 0.60 | 0.40 |
Table 8 Estimation of Acetaldehyde in Suspected Whisky, Rum and Gin samples
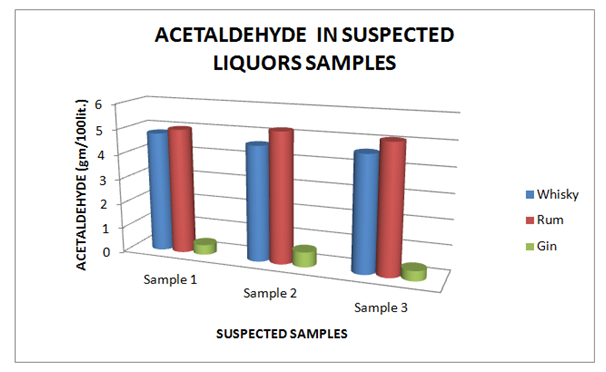
Figure 8 Estimation of Acetaldehyde in Suspected Whisky, Rum and Gin samples.
Estimation of copper
The Table 9 and Figure 9, showing the Copper present in standard Liquor sample as reported in Whisky, Rum and Gin were found to be under the permissible limits described by BIS. However, Table 10 and Figure 10, shows the exceed limit of Copper in the suspected samples of Whisky, Rum and Gin. The Table 11 and Figure 11, showing the Ethyl Acetate present in standard Liquor sample as reported in Whisky, Rum and Gin were found to be under the permissible limits described by BIS. However, Table 12 and Figure 12, shows the exceed limit of Ethyl Acetate in the suspected samples of Whisky, Rum and Gin.
| Brands | Sample 1 | Sample 2 | Sample 3 |
| Whisky | 0.008 | 0.009 | 0.008 |
| Rum | 0.009 | 0.008 | 0.009 |
| Gin | 0.008 | 0.009 | 0.008 |
Table 9 Estimation of Copper in Standard Whisky, Rum and Gin samples
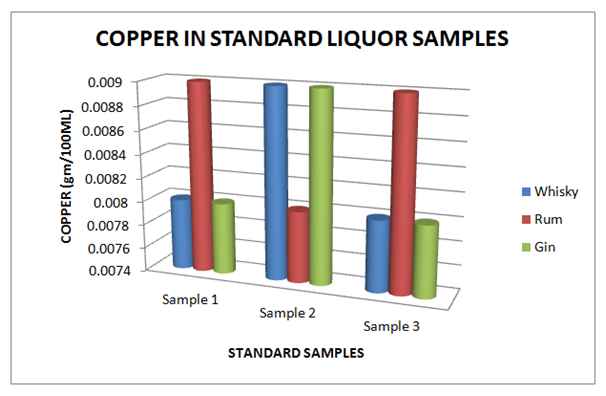
Figure 9 Estimation of Copper in standard Whisky, Rum and Gin samples.
| Brands | Sample 1 | Sample 2 | Sample 3 |
| Whisky | 0.018 | 0.010 | 0.015 |
| Rum | 0.010 | 0.005 | 0.015 |
| Gin | 0.016 | 0.015 | 0.015 |
Table 10 Estimation of Copper in Suspected Whisky, Rum and Gin samples
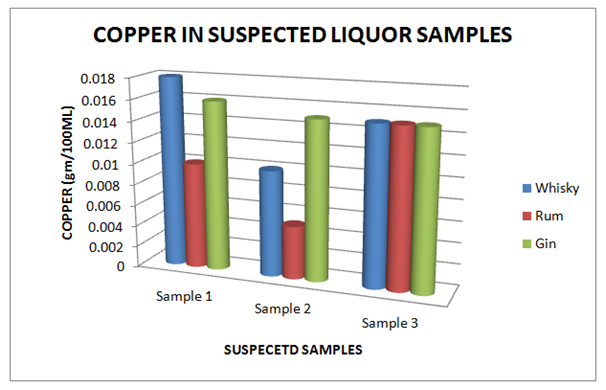
Figure 10 Estimation of Copper in Suspected Whisky, Rum and Gin samples.
| Brands | Sample 1 | Sample 2 | Sample 3 |
| Whisky | 0.24 | 0.28 | 0.28 |
| Rum | 0.18 | 0.20 | 0.18 |
| Gin | 0.58 | 0.60 | 0.58 |
Table 11 Estimation of Ethyl Acetate in Standard Whisky, Rum and Gin samples
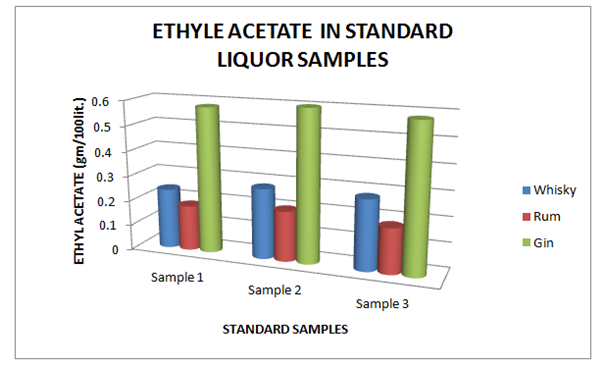
Figure 11 Estimation of Ethyl Acetate in Standard Whisky, Rum and Gin samples.
| Brands | Sample 1 | Sample 2 | Sample 3 |
| Whisky | 0.40 | 0.60 | 0.40 |
| Rum | 0.20 | 0.15 | 0.20 |
| Gin | 0.80 | 0.60 | 0.60 |
Table 12 Estimation of Ethyl Acetate in Suspected Whisky, Rum and Gin samples
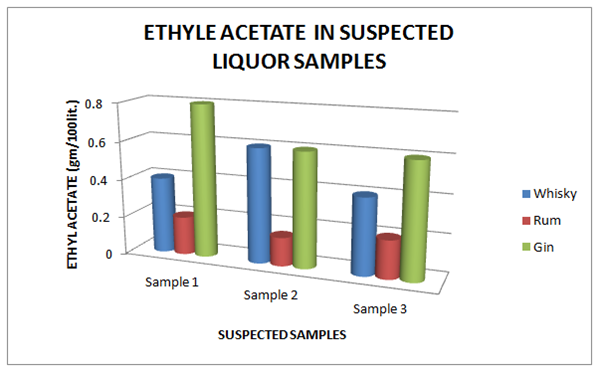
Figure 12 Estimation of Fixed Acidity in Standard Whisky, Rum and Gin samples.
Conclusion
These research work present the suspected sample of liquor are the various type of contamination and the results are shown that the liquor are not drinking purpose. The adulterants contaminations is a major problem in India. The partial data available around prices, it appears that there is ground for the probability that at minimum some home or locally made beverages are cheaper than mass or factory produced “branded” beverages. In some cases the price difference is quite significant. This means that it is mostly the poorer segments of the society which consume these local beverages, except in the case of some culturally important beverages which might have ceremonial value.
Acknowledgements
None.
Conflict of interest
Author declares that there is none of the conflicts.
References
- European Council. Off J Eur Comm L. 1989;160:1–17.
- Karnataka Excise Rules (Regulation of Yield, Production and Wastage of Spirit, Beer, Wine or Liquors) (1997).
- Lehtonen PJ, Keller LA, Ali-Mattila ET. Z Lebeansm Unters Forsch A. 1999;208:413–417.
- Bureau of Indian Standards, Indian standard manual for alcoholic drinks and methods of test, 1986.
- Frank W. Qualittssicherung, Organisation und Analy-senmethoden. In: Kolb E editor. Spirituosen Technologie. Behr’s Verlag, Germany: Hamburg; 2002. p. 425–472.
- http://www.smirnoff.com
©2018 Pandey, et al. This is an open access article distributed under the terms of the, which permits unrestricted use, distribution, and build upon your work non-commercially.