Every cask loses liquid during maturation. Distillers call this the Angel’s Share. It is evaporation through the staves, but it is not only a loss of volume. The changing mix of alcohol, water and air inside the cask quietly rewrites flavour.
Temperature, humidity, air flow, cask size and warehouse style all change how fast evaporation happens and what is lost. In humid, cooler stores the spirit tends to lose more ethanol and hold water. In hot, drier stores water can be lost faster than ethanol. That shift matters because alcohol and water extract different things from oak and drive different reactions over time.
Ethanol loss: When ethanol escapes faster than water, the alcohol by volume (ABV) falls. Lower ABV favours extraction of water soluble compounds such as ellagitannins, gallic acid and vanillic acid. These add gentle vanilla, light nuttiness and woody spice. The overall profile usually feels softer.
Water loss: When water evaporates faster, the ABV rises. Higher ABV pulls more alcohol soluble compounds such as whisky lactone, vanillin and longer chain esters. Expect richer vanilla, coconut and riper fruit notes like apple and pineapple from esters such as ethyl hexanoate.
Flavour concentration: Each year there is less liquid in the cask. What remains becomes more intense. Vanillin, furfural and long chain esters stand out more clearly. Older casks can feel almost syrupy on the palate.
Oxidation: Evaporation creates headspace and oxygen enters through the wood. Oxygen turns ethanol into acetaldehyde and then acetic acid. Acids and alcohols react to form fruity esters. Phenolic smoke softens into leather, spice and dried fruit.
Volatile shift: Lighter aroma molecules leave the cask more readily. Bright esters such as ethyl butyrate and isoamyl acetate, and aldehydes like acetaldehyde, can drop away. Heavier, more persistent aromas then take the lead.
pH drift: Acetic acid, with smaller roles from formic and succinic acids, accumulates over time. pH falls slightly. This changes extraction rates from oak and nudges oxidation pathways, adding complexity.
The Angel’s Share is more than a poetic loss. It is one of the main forces that decides whether a spirit leans fruity, spicy, nutty or rich. In Scotland it may mean a slow, steady transformation over decades. In Jamaica it can mean rapid concentration and bold flavour development within a few short years. Years do not translate one to one – the chemistry takes a different path, and so does the flavour.
John Angus is a UK based chemist and whisky educator who shares the science of flavour through his newsletter, The Distilled Edit. Connect on LinkedIn at http://linkedin.com/in/john-angus, read the newsletter at https://www.linkedin.com/newsletters/the-distilled-edit-7339239882814308352, and explore whisky flavour infographics at https://payhip.com/SpiritChemistry.
Correspondence: Mahipal Singh Sankhla, Research Scholar, Division of Forensic Science, SBAS, Galgotias University, Greater Noida, India
Received: July 31, 2018 | Published: August 31, 2018
Citation: Pandey RK, Sankhla MS, Kumar R. Determination of adulterants in suspected liquor samples using chemical tests. MOJ Toxicol. 2018;4(4):309–314. DOI: 10.15406/mojt.2018.04.00118
Abstract
The term alcohol, used as a proper name, is applied both to the absolute substance farther specified by chemists as ethyl alcohol, and to its mixtures with smaller proportions of water and slight proportions of other substances. In chemistry, the word alcohol is used as a common or generic name to designate several series of substances. Alcohol consumption has existed in India for many centuries. The quantity pattern of used and resultant problems have undergone substantial changes over the past twenty years. This category, created for revenue purposes, consists in western- style distilled beverages such as whisky, rum, gin. These are made in India under government license and the maximum alcohol content allowed is 42.8%. Besides licensed distilleries, a number of small production units operate clandestinely. The raw materials they used are similar to those in country liquor, but since they evade legal quality controls the alcohol concentration in their products varies and adulteration is frequent. It is common to rum, whisky and gin find samples containing up to 56% alcohol. The hazardous adulterant is industrial methylated sprit which irregularly cause mass toxicity of humans who lose their lives or suffer irreversible eye damage. Since no government revenues are paid, illicit liquor is considerably less expensive then license country liquor, and thus finds a ready market among the poor.
Describes a simple, fast method of proving identity or brand on the basis of anion composition. This will enable the testing of suspicions that arise during food control. Spirits are reduced to bottling strength with water from rectified distillates. The ionic content of the water and brand-specific water additives used give rise to differences in the ionic composition of the product. The simple, cost-saving, and reliable method of ion chromatography, which is already approved in water analysis, can therefore be used for the determination of anions in spirits. The Selected decreases the organoleptic features of the raw resources. Flavouring may be added to give the product special organoleptic characteristics, such as a mellow taste.1 According to Karnataka Excise Rules (1997), the ethanol content of whisky, rum and gin (IMFL) are mandated at 42.8% volume by volume (75° proof) and of country liquor or arrack at 33.3% volume by volume (65° proof) at 15/15°C. The Karnataka Excise Act specifies that for the manufacture of IMFL and arrack, the basic material is Rectified spirit [manufactured by distillation of molasses] of not less than 166° proof. Such spirit has to be reduced to strengths of 75° proof or 65° proof depending on whether IMFL or arrack is the final product.2 The authenticity of cognacs, whiskies, rums and similar strong alcoholic beverages can be verified by determining the concentrations of ethanol and the following congeners in the product: methanol, higher alcohols and ethyl acetate. These values are then compared with a database of reference samples. Data from quantitative measurement can be processed statistically using principal component analysis (PCA) based on clustering techniques. PCA is a useful method when the data contain large numbers of variables. PCA yields a small body of new variables that incorporate most of the information in the original variables, facilitating the perception of complicated matrices. Such a work-up is presented by with various brands of whiskies being classified into groups by chemical analysis and PCA. Developed a complex, multi-method analysis for brand identification using statistical processing on the basis of chemical composition, ultraviolet absorption, and pH.3 According to Bureau of Indian Standards (1986), the ethanol content of whisky, rum and gin (IMFL) are mandated at 42.8% volume by volume (75° proof) and of country liquor or arrack at 33.3% volume by volume (65° proof) at 15/15°C. The Bureau of Indian Standards specifies that for the manufacture of IMFL and arrack, the basic material is Rectified spirit (manufactured by distillation of molasses) of not less than166 proof. The ingestion of drinks with the nonqualified raw materials containing high levels of adulterants can cause serious health difficulties like metabolic problems, blindness, permanent neurological damage or even death.4 Suggested about traditionally colorless, extract-free spirits (e.g. vodka and white rum) are identified by the detection of volatile substances using gas chromatography (GC).5 The raw spirit put through rectification is usually produced from grain (rye and wheat) and potatoes. In vodka production, the quality of water is of the utmost importance. For premium vodka brands, demineralized water is filtered through activated carbon to absorb unwanted organic and inorganic materials. Then it is passed through deionization columns, which remove other impurities present. The rectified spirit and demineralized water are blended in the correct proportions. The blended spirit is charcoaled for up to 8 h. The charcoal adsorbs impurities that cannot be removed by distillation alone. The vodka is then reduced to its bottling strength by adding further demineralised water.6
Materials and methods
Determination of ethyl alcohol by volume
Two methods have been prescribed in BIS, namely, method I {Hydrometer method (2302-1962)}, method II {Pyknometer method}. In which method I be used as routine method, whereas Method II as referee method.
Procedure: 200ml of sample were taken in a 500ml. distillation flask containing to it about 25ml. of distilled water and a few pieces of pumice stone {a very light porous rock formed from solidified lava, used in solid form as an abrasive and in powdered form as a polish} was added. And the distillation setup is allowed to heat over thermostat, the distillate is collected in a 200ml. measuring flask. The distillate is allowed to cool at the room temperature; the volume was makeup to 200ml. using distilled water and mixed thoroughly. The specific gravity of the distillate at the required temperature was measured with the help of a hydrometer (routine test) and Pyknometer (referee test). The readings were recorded and compared with the standard value as prescribed in the tables of Alcoholometry.4
Determination of suspended solids
Procedure: The contents of the container were mixed thoroughly by shaking it. 250ml. of it were taken and filtered through a dry tared filter paper. The filter paper was dried over the hot air oven at 110o±2oC. After cooling the sample is weighed. And the results were calculated and expressed to four decimal places.
Determination of esters as ethyl acetate
Procedure: To the neutralized distillate from the volatile acidity determination, 10ml. of standard alkali solution was added and refluxed it on a stream bath for an hour. The sample was cooled and back titrated, the excess of alkali with standard sulphuric acid (1ml. of standard alkali is equivalent to 0.0088gm. of acetate). A blank taking 50ml. of distilled in place of the distillate of the sample is run simultaneously in the same way. The difference in titration value in ml. of standard acid solution gives the equivalent ester.4
Determination of higher alcohols
Three methods have been prescribed in BIS, namely, method I (Komarowski method), Method II. Method I may be used to determine approximately the quantity of higher alcohols in process control. Method II shall be employed for accurate determination while method III shall be used as reference method.4
Method I (Komarowski method)
Procedure: A clean glass–stoppered bottle was taken and washed it twice with the spirit to be tested. Similarly, a small cylinder or a 100ml pipette was washed. 10ml. of sprit were taken in the bottle and to it 1ml. of 1% salicylic aldehyde and 20ml. of conc. Sulphuric acid were added. The mixture was allowed to stand at room temperature for over 12hours. The change in colour was noted and compared with the colour developed after the reaction indicates the amount of higher alcohol as follows:
Colour Amount of higher alcohol
Light yellow only traces
Yellow to Brown About 0.1% (v/v)
Brown About 0.2% (v/v)
Red About 0.5 to 1.0 % (v/v)
Dark red to Black About 0.5 to 1.0% (v/v)
Method II
Procedure: 50ml. of water was added to the solution resulting from the determination of esters and solution is extracted four times with carbon tetrachloride using 40, 30, 20 and 10ml. respectively. The extracts were washed three times with saturated sodium chloride solution and twice with saturated Sodium Sulphate solution. Carbon tetrachloride was filtered out and to it 50ml. of oxidizing mixture was added and refluxed for two hours. The solution was cooled and the reflux condenser was washed with 50ml. of water and transferred it to the distillation flask using50 ml. of water. Distil till about 50ml. is left over the flask. Avoid charring. The distillate is titrated against standard alkali, using phenolphthalein as indicator (1ml. of standard alkali is equivalent to 0. 0088gm. of amyl alcohol.) Run a blank in the same way taking 100ml. of distilled water in place of the distillate of the liquor.
Determination of ash
Procedure: The contents of the container were shaken and evaporated, 100ml. of the sample is on dried, tared dish over water bath. The dish was placed in a muffle furnace maintained at 450o to 500oC for the about an hour. The dish was Cooled in a desiccator and weighed, the results were expressed to four decimal places.4
Determination of copper
Potassium ferrocyanide method
Procedure: Transfer 20ml. of the material into a silica evaporating dish and add 1ml. of dilute sulphuric acid. Heat gently in the beginning and the evaporate almost to dryness on a water bath. Ignite the residue over a smokeless flame to eliminate sulphuric acid. Cool, dissolve the residue in 2ml. of water, add three drops of aqua regia and evaporate to dryness on the water bath. Dissolve the residue in 2ml. of hydrochloric acid and warm gently the residue is dissolved. Add 0.5gm. of ammonium chloride and dilute with 15ml. of water distill in an all glass apparatus. Add dilute ammonium hydroxide as alkaline. Boil off excess of ammonia and filter into a clean Nessler tube. Cool and then render to the solution acidic with acetic acid (3 to 5 drops are usually sufficient). Dilute to 40ml. Add 0.5ml. of potassium ferrocyanide solution, stir and make up the volume to 50ml. {Note: – If the copper is more, a lesser amount of the material may be taken for the test.} Prepare a series of control solutions each containing in 50ml. 0.5gm. of ammonium chloride, 3 to 5 drops of acetic acid and 0.5ml. potassium ferrocyanide solution together with an increase amount of copper, namely 2, 4, 6, 8, and 10ml. of the standard copper solution Compare the test solution with control solutions and note the number of ml. of standard copper solution added in the control solution having, as nearly as possible, the same intensity of color as that of the test solution.4
Result and discussion
These research work was carried out at the India Brewery and Distillery Ltd, Bidar, Karnataka, India. Check the specification of liquors. In the study Qualitative analysis for the presences of illicit content like Copper, Ash, Ethyl Alcohol, Higher Alcohol Content, Acetaldehyde and Fixed Acidity present in the liquor sample were done by using the presumptive colour tests and the results are reported. Content in the samples were analyzed qualitatively and quantitatively for determination of the strength of the liquor sample and results are reported in tables and figures. The quantitative determination of the contents liquors were examined by the prescribed methods of the BIS (3752-1956) guidelines to check their quantity in the suspected liquors as in illicit liquor there me be increased quantity of these contents shown table 1-12 and figure 1-12. These results reported here shows that the suspected liquor shows the presence of illicit components like Copper, Ash, Ethyl Alcohol, Higher Alcohol Content, Acetaldehyde and Fixed Acidity. The quantitative analysis of the suspected and standard samples showed that the contents of standard liquors are within permissible limit of the BIS however the suspected liquor samples showed the exceed limit of these contents.
Estimation of ethyl alcohol (v/v)
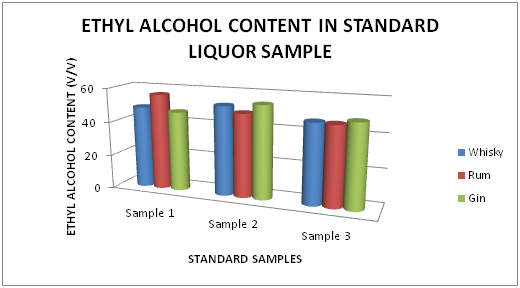
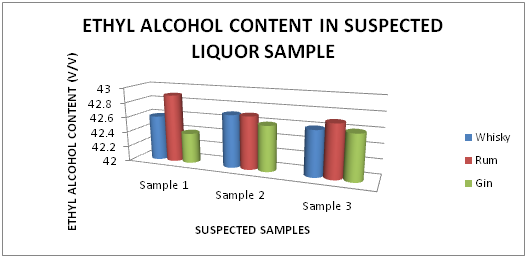
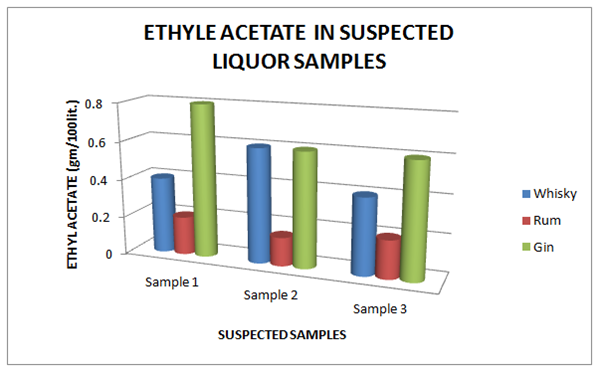
The Table 1 and Figure 1 shows the Ethyl alcohol percentage in standard Liquor sample as reported in Whisky, Rum and Gin were found to be under the permissible limits described by BIS. However Table 2 and Figure 2, shows the exceed limit of ethyl alcohol content in the suspected samples of Whisky, Rum and Gin.
Brands
Sample 1
Sample 2
Sample 3
Whisky
42.6 % v/v
42.7% v/v
42.6% v/v
Rum
42.9% v/v
42.7% v/v
42.7% v/v
Gin
42.4% v/v
42.6% v/v
42.6% v/v
Table 1 Estimation of Ethyl alcohol (%) in standard Whisky, Rum and Gin sample
Figure 1 Estimation of Ethyl alcohol (%) in standard Whisky, Rum and Gin sample.
Brands
Sample 1
Sample 2
Sample 3
Whisky
48.4% v/v
36.5% v/v
34.4% v/v
Rum
56.4% v/v
48.8% v/v
46.4% v/v
Gin
46.8% v/v
54.4% v/v
48.6% v/v
Table 2 Estimation of Ethyl alcohol (%) in suspected Whisky, Rum and Gin sample
Figure 2 Estimation of Ethyl alcohol (%) in suspected Whisky, Rum and Gin sample.
Estimation of ash (%)
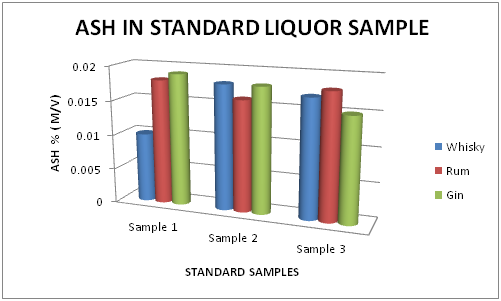
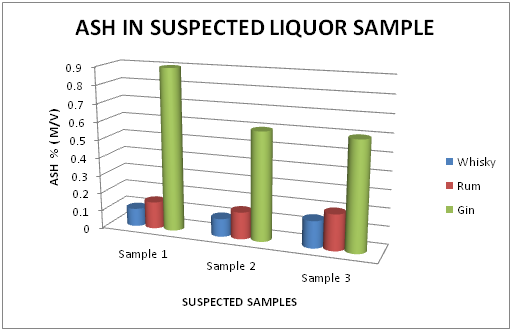
The Table 3 and Figure 3, showing the Ash percentage in standard Liquor sample as reported in Whisky, Rum and Gin were found to be under the permissible limits described by BIS. However, Table 4 and Figure 4, shows the exceed limit of Ash percentage in the suspected samples of Whisky, Rum and Gin.
Brands
Sample 1
Sample 2
Sample 3
Whisky
0.01
0.018
0.017
Rum
0.018
0.016
0.018
Gin
0.019
0.018
0.015
Table 3 Estimation of Ash (%) in Standard Whisky, Rum and Gin samples
Figure 3 Estimation of Ash (%) in standard Whisky, Rum and Gin samples.
Brands
Sample 1
Sample 2
Sample 3
Whisky
0.10
0.10
0.15
Rum
0.15
0.15
0.20
Gin
0.9
0.6
0.6
Table 4 Estimation of Ash (%) in Suspected Whisky, Rum and Gin samples
Figure 4 Estimation of Ash (%) in suspected Whisky, Rum and Gin samples.
Estimation of higher alcohol content
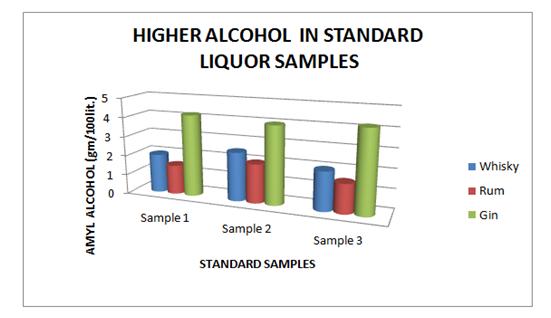
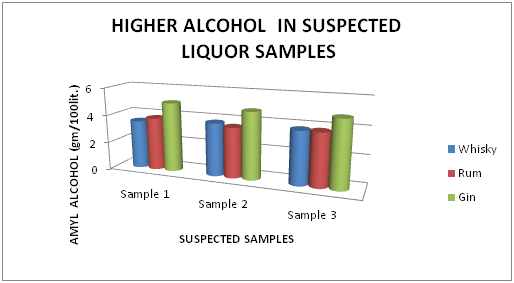
The Table 5 and Figure 5 showing the Higher Alcohol present in standard Liquor sample as reported in Whisky, Rum and Gin were found to be under the permissible limits described by BIS. However, Table 6 and Figure 6, shows the exceed limit of Higher Alcohol in the suspected samples of Whisky, Rum and Gin.
Brands
Sample 1
Sample 2
Sample 3
Whisky
2.00
2.50
2.00
Rum
1.50
2.00
1.50
Gin
4.20
4.00
4.20
Table 5 Estimation of Higher Alcohol in Standard Whisky, Rum and Gin samples
Figure 5 Estimation of higher alcohol in Standard Whisky, Rum and Gin samples.
Brands
Sample 1
Sample 2
Sample 3
Whisky
3.50
3.80
3.80
Rum
3.80
3.60
3.80
Gin
5.00
4.80
4.80
Table 6 Estimation of Higher Alcohol in Suspected Whisky, Rum and Gin samples
Figure 6 Estimation of higher alcohol in Suspected Whisky, Rum and Gin samples.
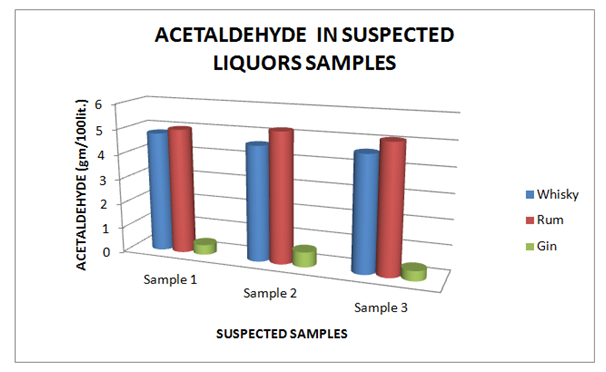
Estimation of acetaldehyde
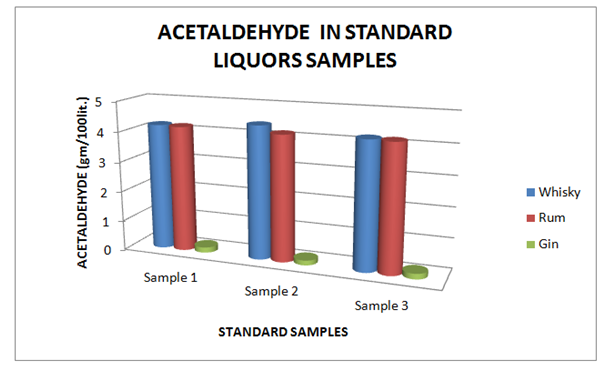
The Table 7 and Figure 7, showing the Acetaldehyde present in standard Liquor sample as reported in Whisky, Rum and Gin were found to be under the permissible limits described by BIS. However, Table 8 and Figure 8, shows the exceed limit of Acetaldehyde in the suspected samples of Whisky, Rum and Gin.
Brands
Sample 1
Sample 2
Sample 3
Whisky
4.2
4.4
4.2
Rum
4.18
4.16
4.18
Gin
0.18
0.16
0.18
Table 7 Estimation of Acetaldehyde in Standard Whisky, Rum and Gin samples
Figure 7 Estimation of Acetaldehyde in Standard Whisky, Rum and Gin samples.
Brands
Sample 1
Sample 2
Sample 3
Whisky
4.80
4.60
4.60
Rum
5.0
5.20
5.10
Gin
0.40
0.60
0.40
Table 8 Estimation of Acetaldehyde in Suspected Whisky, Rum and Gin samples
Figure 8 Estimation of Acetaldehyde in Suspected Whisky, Rum and Gin samples.
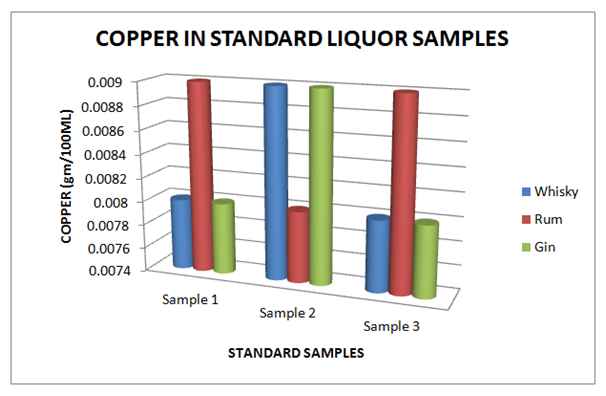
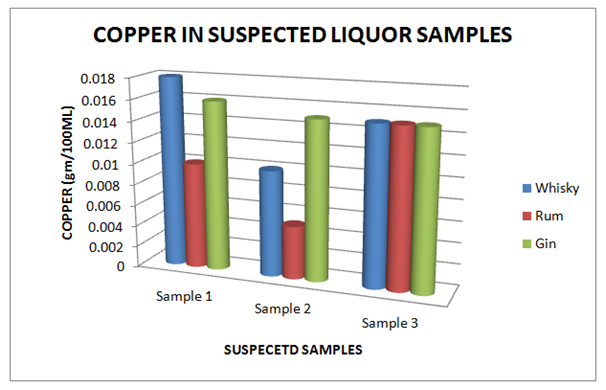
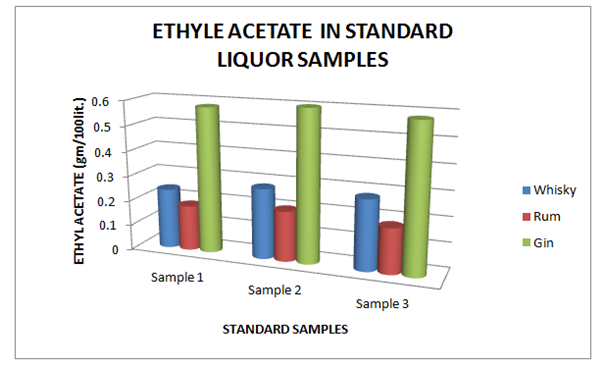
Estimation of copper
The Table 9 and Figure 9, showing the Copper present in standard Liquor sample as reported in Whisky, Rum and Gin were found to be under the permissible limits described by BIS. However, Table 10 and Figure 10, shows the exceed limit of Copper in the suspected samples of Whisky, Rum and Gin. The Table 11 and Figure 11, showing the Ethyl Acetate present in standard Liquor sample as reported in Whisky, Rum and Gin were found to be under the permissible limits described by BIS. However, Table 12 and Figure 12, shows the exceed limit of Ethyl Acetate in the suspected samples of Whisky, Rum and Gin.
Brands
Sample 1
Sample 2
Sample 3
Whisky
0.008
0.009
0.008
Rum
0.009
0.008
0.009
Gin
0.008
0.009
0.008
Table 9 Estimation of Copper in Standard Whisky, Rum and Gin samples
Figure 9 Estimation of Copper in standard Whisky, Rum and Gin samples.
Brands
Sample 1
Sample 2
Sample 3
Whisky
0.018
0.010
0.015
Rum
0.010
0.005
0.015
Gin
0.016
0.015
0.015
Table 10 Estimation of Copper in Suspected Whisky, Rum and Gin samples
Figure 10 Estimation of Copper in Suspected Whisky, Rum and Gin samples.
Brands
Sample 1
Sample 2
Sample 3
Whisky
0.24
0.28
0.28
Rum
0.18
0.20
0.18
Gin
0.58
0.60
0.58
Table 11 Estimation of Ethyl Acetate in Standard Whisky, Rum and Gin samples
Figure 11 Estimation of Ethyl Acetate in Standard Whisky, Rum and Gin samples.
Brands
Sample 1
Sample 2
Sample 3
Whisky
0.40
0.60
0.40
Rum
0.20
0.15
0.20
Gin
0.80
0.60
0.60
Table 12 Estimation of Ethyl Acetate in Suspected Whisky, Rum and Gin samples
Figure 12 Estimation of Fixed Acidity in Standard Whisky, Rum and Gin samples.
Conclusion
These research work present the suspected sample of liquor are the various type of contamination and the results are shown that the liquor are not drinking purpose. The adulterants contaminations is a major problem in India. The partial data available around prices, it appears that there is ground for the probability that at minimum some home or locally made beverages are cheaper than mass or factory produced “branded” beverages. In some cases the price difference is quite significant. This means that it is mostly the poorer segments of the society which consume these local beverages, except in the case of some culturally important beverages which might have ceremonial value.
Acknowledgements
None.
Conflict of interest
Author declares that there is none of the conflicts.
References
European Council. Off J Eur Comm L. 1989;160:1–17.
Karnataka Excise Rules (Regulation of Yield, Production and Wastage of Spirit, Beer, Wine or Liquors) (1997).
Lehtonen PJ, Keller LA, Ali-Mattila ET. Z Lebeansm Unters Forsch A. 1999;208:413–417.
Bureau of Indian Standards, Indian standard manual for alcoholic drinks and methods of test, 1986.
Frank W. Qualittssicherung, Organisation und Analy-senmethoden. In: Kolb E editor. Spirituosen Technologie. Behr’s Verlag, Germany: Hamburg; 2002. p. 425–472.
Greg Hodson1, Eric Wilkes2, Sara Azevedo1 and Tony Battaglene1
1 – FIVS, 18 rue d’Aguesseau, 75008 Paris, France
2 – Australian Wine Research Institute, Hartley Grove, Urrbrae SA 5064, Australia
Abstract
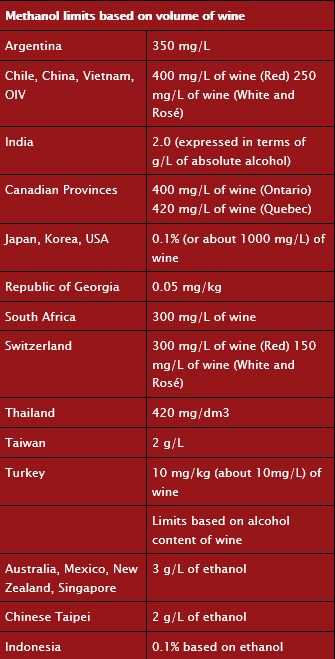
This paper examines the origins of methanol in grape wine and the quantities typically found in it, as well as in other foods such as unpasteurised fruit juices. The toxicology of methanol and the associated regulatory limits established by competent authorities in various parts of the world are also considered. It is concluded that such limits are not driven by public health considerations and thus authorities are requested to consider the need for methanol analyses to be performed and reported on certificates of analysis as a condition of market entry for wine. Where methanol limits are still deemed to be necessary to achieve policy objectives, authorities are encouraged to establish them in the light of the levels of methanol typically found in grape wines produced by the full array of internationally permitted winemaking practices, and to consider harmonising their limits with those that have already been established by other governments or recommended by appropriate intergovernmental organisations.
This is an Open Access article distributed under the terms of the Creative Commons Attribution License 4.0 (http://creativecommons.org/licenses/by/4.0/).
Introduction
The origin and significance of methanol in wine, and the associated establishment of regulatory limits for its presence there, are causes of much confusion and misunderstanding in international trade. This paper, produced by the FIVS Scientific and Technical Committee, reviews the topic in some detail, providing reference materials to assist with further study. It concludes that the levels of methanol commonly found in grape wines are broadly similar to those that may be found in many freshly squeezed and unpasteurised fruit juices if they are stored for a period of time after squeezing. It is further demonstrated, from a comparison of regulatory limits for methanol in wine with food safety risk assessments that have been conducted by reputable bodies, that the limits themselves do not serve any real food safety purpose. This is because many litres of wine per day or even per hour would need to be consumed (even if the product contained the highest content of methanol permissible in regulations) to even approach intake levels of any known toxicological concern [1].
2. Chemical properties and other information for methanol
Methanol is chemically characterized as follows [2]:
2.1. Chemical Formula, Synonyms, CAS Registry number
Chemical formula: CH3OH
Synonyms: Methyl alcohol, Carbinol, Wood alcohol
CAS Registry Number: 67-56-1.
2.2. Physico-chemical properties
Physical appearance: Methanol is a colourless liquid with characteristic odour.
Melting Point: –98 °C
Boiling Point: 65 °C
Solubility in water: Miscible.
3. Origin of Methanol in wine
3.1. Action of pectinase enzymes
3.1.1. Action of endogenous pectinase enzymes on pectin in grapes
Methanol is produced before and during alcoholic fermentation from the hydrolysis of pectins by pectinase enzymes (such as pectin methylesterase) which are naturally present in the fruit. More methanol is produced when must is fermented on grape skins; hence there is generally more in red wines than in rosé or white wines (see Sect. 4 below).
3.1.2. Use of exogenous pectinase enzymes in winemaking
Exogenous pectinase enzymes are permitted for use in winemaking (generally as clarifying agents) in at least the following countries: Australia, Canada, the 28 Member States of the European Union, Japan, the Republic of Georgia, New Zealand, South Africa, and the United States. Their use is also deemed to be an acceptable winemaking practice by the International Organisation for Vine and Wine (OIV) [3]. As with the activity of pectinases naturally present in grapes, the use of exogenous pectinases as a winemaking practice will have the effect of increasing the levels of methanol in the resulting wine.
3.2. Treatment of wine with Dimethyldicarbonate
Dimethyldicarbonate (DMDC) is an effective pre-bottling sterilant, accepted for use in winemaking in Argentina, Australia, Cambodia, Canada, Chile, the 28 Member States of the European Union, the Republic of Georgia, Hong Kong China, Myanmar, New Zealand, Russia, Singapore, South Africa, Thailand, Turkey and the United States, whose use is generally limited in international regulations and recommendations to a maximum treatment of 200 mg/L of wine [4]. For other alcoholic beverages and mixtures of alcoholic and other beverages with an alcoholic strength by volume of less than 15%, the limit on usage is often set at 250 mg/L. The use of DMDC can be important in stabilizing lower alcohol products from additional fermentation in the bottle, and also allows a reduction in the quantity of sulphur dioxide that is used where the oxygen in wine is kept below 1 mg/L. DMDC breaks down rapidly in wine, producing carbon dioxide and leaving methanol at very low levels not harmful to health and other innocuous products in the wine. Methanol at a level of about 100 mg/L is created in wine from a DMDC treatment at the typical maximum treatment level of 200 mg/L [5].
4. Typical levels of methanol in wine
It was noted above that the presence of low levels of methanol in wine is expected due to the action of pectinase enzymes that are naturally present in the grapes. A study of the literature indicates the following information concerning the typical levels of methanol that may be found in wine (these levels generally do not account for any additional amount that may result from a DMDC treatment):
• Red wines will tend to contain more methanol (between 120 and 250 mg/L of the total wine volume) than white wines (between 40 and 120 mg/L of the total wine volume), because of the longer exposure to grape skins during the fermentation [6].
• Wines made from grapes that have been exposed to Botrytis cinerea (e.g. late harvest wines, such as Sauternes or Tokay) also have higher methanol levels than standard grape wines (as much as 364 mg/L of the total wine volume) [7].
• Wines made from non Vitis vinifera grapes tend to contain more methanol than wine from pure Vitis vinifera [8].
4.1. Case study: Typical levels of methanol in Australian wine
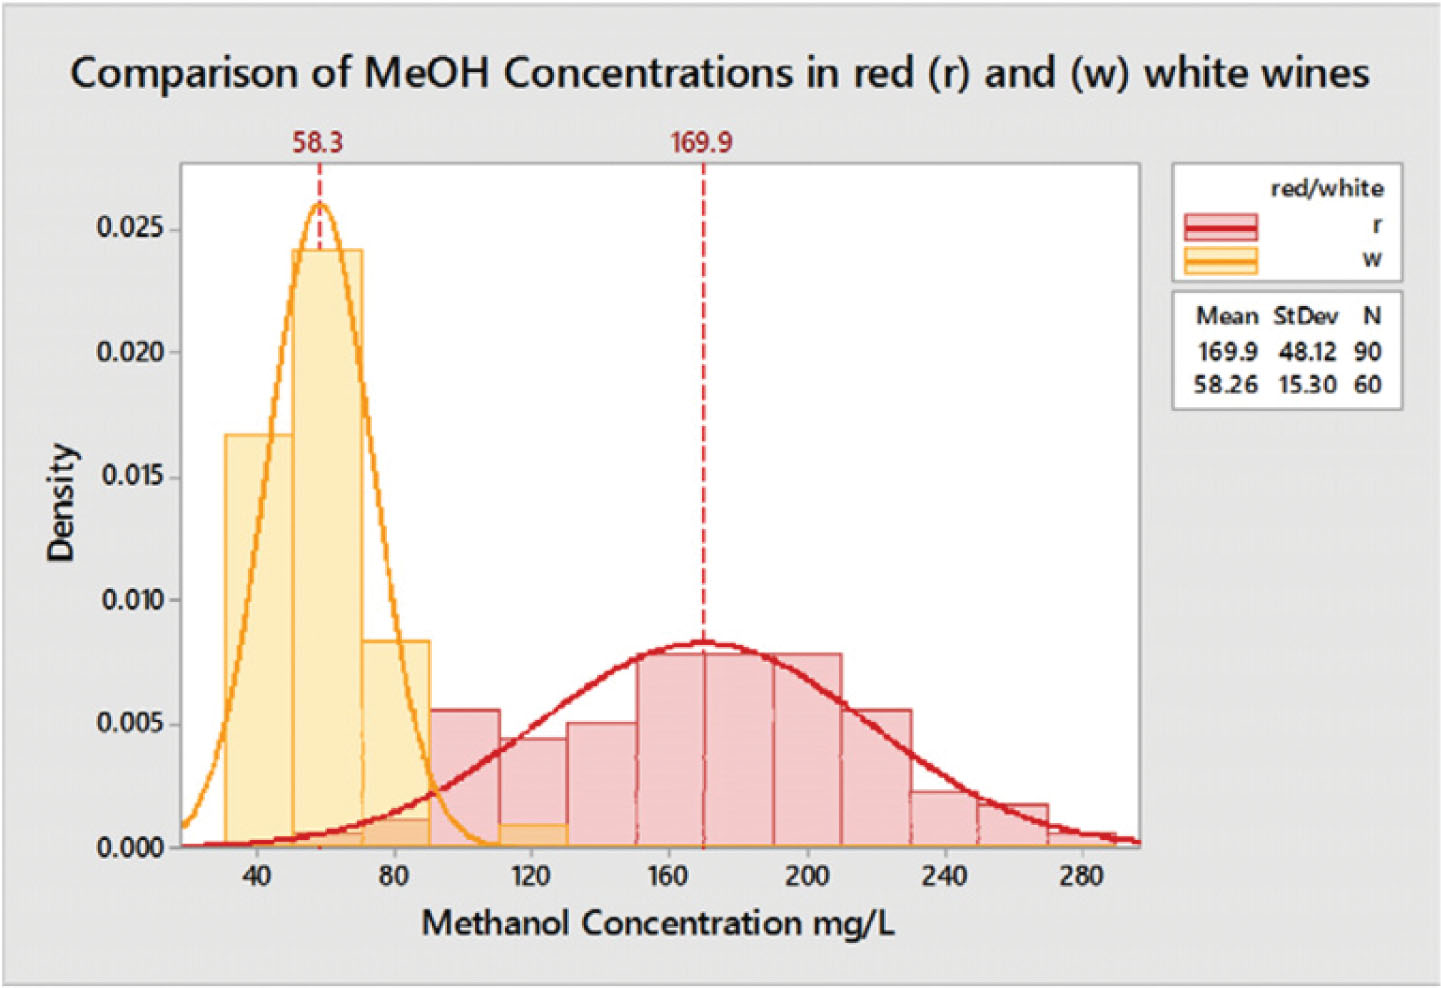
A recent survey looked at 150 wines from across Australia to determine typical levels of methanol in commercial wine [9]. The sample set consisted of 90 red and 60 white wines from multiple varieties and vintages. All wines were analysed using a GC-FID in the Australian Wine Research Institute’s ISO 17025 accredited laboratory. No evidence of DMDC treatment (a source of methanol) was found for any of the wines tested.
Typical ranges for methanol found in Australian wines were; 60–280 mg/L in reds (mean 170 mg/L) and 40–120 mg/L in whites (mean 58 mg/L). All wines tested had some methanol content. The main driver for higher methanol levels appeared to be skin contact during processing. Variety or vintage had no significant impact.
4.1.1. Typical values
Results for red and white wines were significantly different. Red wines typically contained higher levels of methanol across a larger range of content, reflecting greater variation in skin contact times. All wines were found to be within Australian and OIV guidelines (Fig. 1).
Figure 1
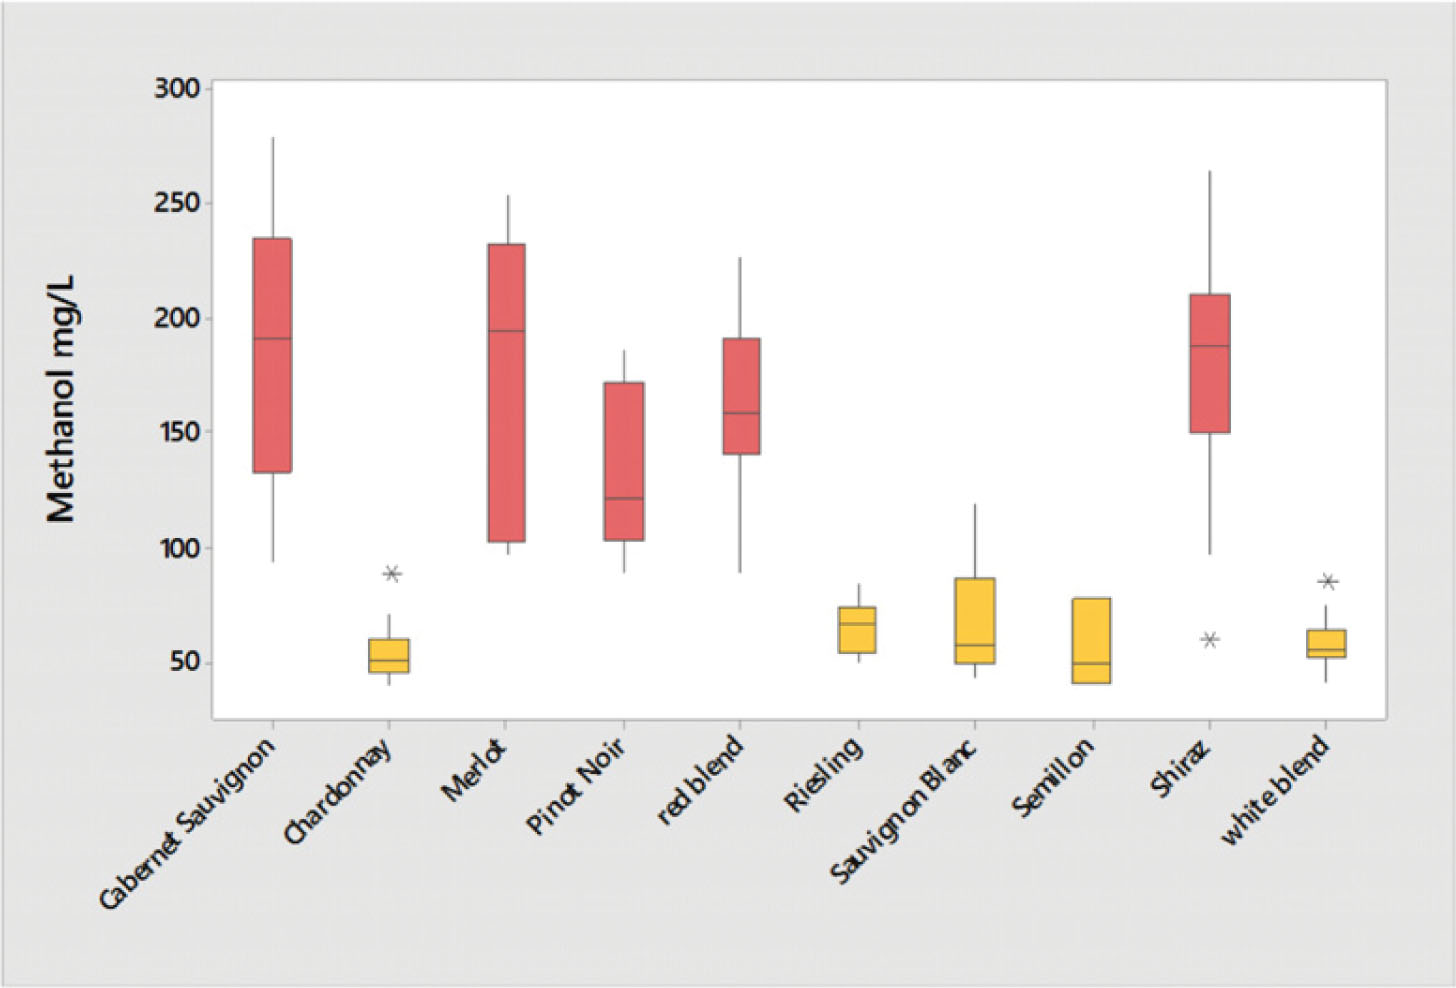
4.1.2. Impact of variety
No significant differences of methanol content were found based on grape variety. The only difference found was between red and white wines, reflecting the differences in processing for the different wine styles (Fig. 2). 4.1.3. Impact of vintage
Figure 2
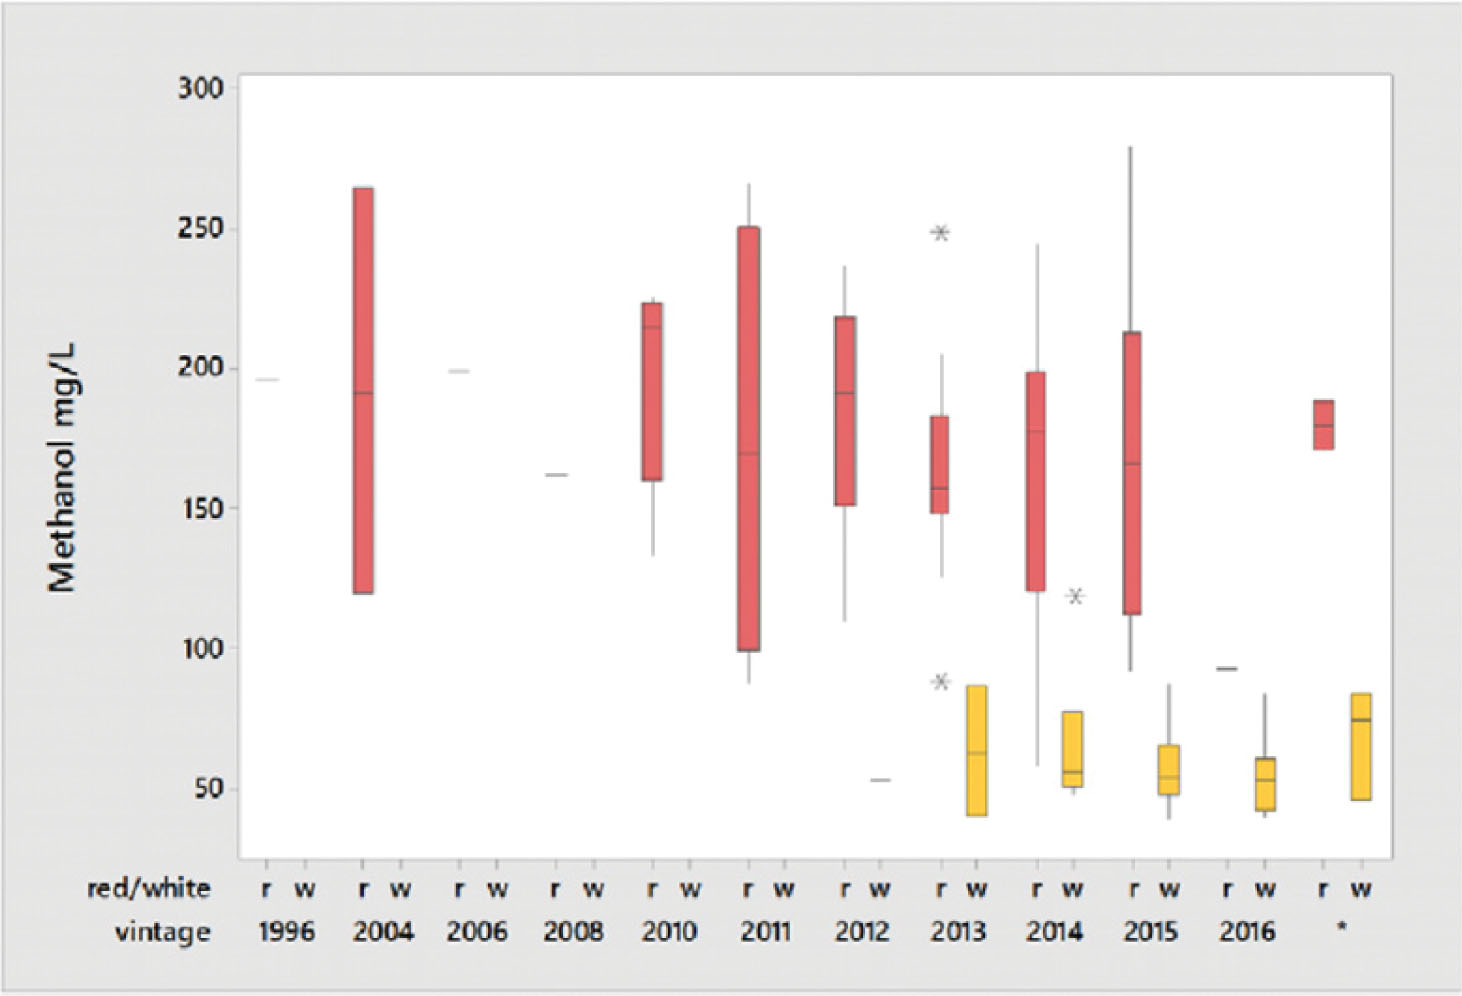
4.1.3. Impact of vintage
Figure 3
No significant impact of year of production on the methanol concentration was found (Fig. 3).
With oil prices on the uptake the need to blend ethanol at a faster pace is the need of the hour. A boon for sugar mills considering that India imports 20% of its oil requirements.
Coming to the aid of cash-starved sugar mills, the Cabinet Committee on Economic Affairs has decided to raise the prices of ethanol derived out of molasses by `2.85 a litre.
The Committee decided to raise the price of ethanol derived out of C-heavy molasses to `43.70 per litre from `40.85, excluding GST and transportation charges.
Similarly, for the first time, the CCEA has fixed the price of ethanol derived from B-heavy molasses and sugarcane juice at `47.49 per litre, excluding GST and transportation charges. These prices are based on the estimated Fixed and Remunerative Price of sugarcane and will be applicable for the ethanol supply year, starting December 2018 and ending November 2019.
He also said that this will be one more step towards achieving 10% ethanol blending, for which 313 crore litres of ethanol is required, according to industry body ISMA. More ethanol blending translated into lower crude imports.
The ethanol procured by Indian Oil, HPCL and Bharat Petroleum has increased from 38 crore litres in 2013-14 to an estimated 140 crore litres in 2017-18. Mills are expecting revenue realisation of over `5,000 crore from sale of ethanol to OMCs during the 2017-18 sugar season (October-September).
Abstract
For a long time, alcohol was thought to exert a general depressant effect on the central nervous system (CNS). However, currently the consensus is that specific regions of the brain are selectively vulnerable to the acute effects of alcohol. An alcohol-induced blackout is the classic example; the subject is temporarily unable to form new long-term memories while relatively maintaining other skills such as talking or even driving. A recent study showed that alcohol can cause retrograde memory impairment, that is, blackouts due to retrieval impairments as well as those due to deficits in encoding. Alcoholic blackouts may be complete (en bloc) or partial (fragmentary) depending on severity of memory impairment. In fragmentary blackouts, cueing often aids recall. Memory impairment during acute intoxication involves dysfunction of episodic memory, a type of memory encoded with spatial and social context. Recent studies have shown that there are multiple memory systems supported by discrete brain regions, and the acute effects of alcohol on learning and memory may result from alteration of the hippocampus and related structures on a cellular level. A rapid increase in blood alcohol concentration (BAC) is most consistently associated with the likelihood of a blackout. However, not all subjects experience blackouts, implying that genetic factors play a role in determining CNS vulnerability to the effects of alcohol. This factor may predispose an individual to alcoholism, as altered memory function during intoxication may affect an individual’s alcohol expectancy; one may perceive positive aspects of intoxication while unintentionally ignoring the negative aspects. Extensive research on memory and learning as well as findings related to the acute effects of alcohol on the brain may elucidate the mechanisms and impact associated with the alcohol-induced blackout.
Keywords: blackout, alcohol, memory
1. Introduction
Alcohol is a threat to global health, accounting for 4% of the global health burden, a proportion that is comparable to tobacco and hypertension [1]. Dysfunctions of multiple organ systems brought on by chronic alcohol use, including the brain, have long been the focus of medical concern, and are well documented in the public health literature. Nevertheless, alcohol continues to be a part of human culture. Acute effects of alcohol intoxication are a common, often voluntary experience and not necessarily considered a problem in itself. The alcoholic blackout, however, is one phenomenon of acute alcohol intoxication that merits special attention. Initial research in the 1950s reported that such blackouts are a hallmark of progressive alcoholism [2,3]. However, further research has proved otherwise, and blackouts are no longer considered as a signal of irreversible alcoholism [4]. Perhaps because the majority of people experiencing an alcoholic blackout are not clinically alcohol dependent, alcoholic blackouts may have been relatively neglected in terms of treatment intervention. Rather, legal matters have been the focus of cases where violations of the law are committed under intoxicated, amnesic states.
The mechanisms of an alcohol-induced blackout may be crucial in understanding its clinical implications. For a long time the effect of alcohol was thought to be a generalized depression of neural activity causing global impairment of cognitive, psychological, and behavioral domains [5–7]. An alcoholic blackout was perceived as the extreme manifestation of this effect. However, the blackout, characterized by amnesia during episodes of intoxication where the subject is conscious and able to carry on conversations or even drive a vehicle [8,9], is a manifestation of the selective effects of alcohol on specific brain systems. Previously, ethanol, a short chain lipid soluble compound, was thought to affect cells by a nonspecific lipid membrane disordering effect [5,6,10]. However, it is increasingly evident that alcohol interacts with specific neurotransmitter receptors, and current consensus is that specific regions of the brain are selectively vulnerable to acute effects of alcohol [5,10–15].
We need to make the memory staging terms clear as follows: immediate memory is also termed acquisition memory; short-term is also called retention memory; recent is called also consolidation memory and finally remote is referred to as also retrieval memory. Progress has been made in elucidating the mechanism of various memory systems and how they are affected by alcohol. There is increasing evidence that repeated alcoholic blackouts actually serve as a mechanism that facilitates alcoholism [2,16]. In this paper we aim to describe and discuss the alcoholic blackout to improve the understanding of this phenomenon and recognize its many faceted implications in medical practice and public health.
2.Methods
The PubMed database was searched (1965 to 2009) for epidemiological, pathophysiological, and social studies related to the alcoholic blackout, using the terms blackout, alcohol and memory, episodic memory, hippocampus and alcohol, and alcohol and the nervous system. The bibliographies of selected articles were used to extend the search. Articles were screened for their relevance to the specific topic of alcoholic blackout and related memory deficits on the basis of the title and abstract.
3.Clinical and Physiological Characteristics
3.1. Definition
An alcoholic blackout is amnesia for the events of any part of a drinking episode without loss of consciousness. It is characterized by memory impairment during intoxication in the relative absence of other skill deficits. It is not to be confused with ‘passing out’ [9]. Early documentation from Alcoholics Anonymous describes a variety of blackout behavior, especially in the en-bloc type, which includes driving for long distances or carrying on apparently normal conversations at parties. Subjects often report waking in strange places without any memory of how they got there. Criminal acts including murder, have been reported [17]. Although some have criticized these extremes, stating that such behavior is “exaggerated and a form of selective memory or denial to avoid guilt and confrontation over antisocial behavior brought on by drinking” [9], it nevertheless portrays the selective impairment of memory during an alcohol-induced blackout.
3.2. Types of Alcoholic Blackouts
An alcoholic blackout may be complete (en-bloc) or partial (fragmentary, or grayout) [2,9]. An en bloc blackout is complete amnesia for significant events otherwise memorable under usual circumstances. The defining characteristic of a complete blackout is that memory loss is permanent and cannot be recalled under any circumstances. Fragmentary blackouts occur more frequently [18,19]. In fragmentary blackouts, recall is usually possible and can be aided by cueing. Although initially the subject may be unaware that memory is missing, reminders usually help the subject remember forgotten events [9]. It is, however, difficult for investigators to be totally accurate because people may often fail to remember having a blackout, or do not attend to all circumstances in which they might have had a blackout, particularly fragmentary blackouts. Therefore, metamemory deficit is an issue in this type of research.
4.Epidemiology
A high frequency and volume of alcohol use is the single factor most closely related to experiencing blackouts [7]. In contrast to the older misconception that blackouts are an unlikely consequence of heavy drinking in nonalcoholics, anyone who drinks too much and too fast may experience a blackout [4]. For instance, 35% of trainees in a large pediatric residency program had reported experiencing at least one blackout [20]. In addition, 33% of first year medical students interviewed in another study acknowledged experiencing at least one blackout [8]. A survey of 2,076 Finnish males concluded that 35% experienced at least one blackout in the year before the survey [21]. Cultural and socioeconomic backgrounds are associated factors. The college campus is one subculture where excessive drinking is tolerated, if not encouraged. In a survey of 772 undergraduates, approximately one-half of those that had ever consumed alcohol reported experiencing at least one blackout during their lives, and 40% experienced one the year before the survey [22].
However in a four year follow up of young blackout drinkers, only 32% of respondents that were experiencing blackouts in the initial survey continued to experience them four years later. Alcoholic blackouts in this group appeared to have resolved spontaneously when the subjects graduated college, got married, or successfully entered the adult work force. Spontaneous resolution of blackout drinking appears to result from an interaction between informal support and objective social conditions such as full-time employment and a positive financial situation. To a certain extent, life transitional changes such as assuming adult roles appear to be a strong influence on the process of disengagement from problem drinking. Those who continued to experience blackouts after four years were male, comparatively young, unmarried, and with a lower socioeconomic status. The most salient predictor of chronic blackout drinking was the number of alcoholic relatives [9].
4.1. Risk Factors
Although a high blood alcohol concentration is required to induce a blackout, many drinkers reminisce that they have drank much more and not had a blackout [7]. A rapid rate of increase in blood alcohol concentration (BAC) is most consistently associated with the occurrence of an alcoholic blackout [7,23,24]. Therefore, gulping drinks, drinking on an empty stomach, or drinking liquor (opposed to beer) are risk factors of an alcoholic blackout [7]. However, not all subjects who drink rapidly and excessively experience blackouts, suggesting that there are individual that are genetically more vulnerable to alcohol-induced memory impairment [2,7,25]. Alcohol-induced blackouts are not necessarily the result of an underlying cognitive dysfunction; in a study of fragmentary blackouts, there was no baseline memory differences among the subjects that did or did not experience an alcohol-induced blackout [2]. This means that a baseline memory function does not seem a risk factor of blackouts.
5. Pathophysiology
A blackout is the result of alcohol-induced disruption of memory formation. The formation of memory involves the following processes: encoding, the initial registration and interpretation of stimuli; storage, consolidation and maintenance of encoded stimuli; and retrieval, which is the search and recovery of stored stimuli [2]. Alcohol has its greatest effects on encoding [26]. Short-term memory, which functions over a period of seconds, is relatively spared even during an en-bloc blackout, and recall of long-term memory, which applies on the scale of days to years, established before intoxication is also maintained [7].
Amnesia for events during intoxication involves impairment of episodic memory [3,7]. Episodic memory, by definition, includes the time, place, and other interrelated circumstances in which the event occurred. This contextual information is a prerequisite for formation of episodic memories [27,28]. Alcohol’s effect on encoding may disrupt the processing of context for the formation of an episodic memory. Because the episode was encoded with faulty context, free recall of this memory may be particularly difficult [29,30] or, depending on the degree of encoding impairment, even impossible, as in the case of en-bloc blackouts. In a fragmentary blackout, a striking feature is that cueing aids recall. Reminding a subject of events during the blackout often brings on more forgotten memories [4]. Such reminders, or cues, may provide contextual information during which a memory was formed, giving access to memory that was deficiently encoded.
The cellular mechanism by which a context is generated has been partially elucidated by observation of ‘place cells’ in rodents. Place cells are cells in the rodent brain which fire when the animal is in a particular location in the environment [31]. These location-specific cells ultimately create a spatial map in the brain, serving as a framework for event memories created in that environment. These cells are found in the CA1 pyramidal cell layer of the hippocampus. Alcohol profoundly suppresses activity of these cells. The dose-dependent suppression of CA1 pyramidal cells is consistent with dose-dependent effects of alcohol on episodic memory formation [28,32]. Evidence suggests that cognitive abilities mediated by the hippocampus might be particularly sensitive to the effects of moderate doses of alcohol [32]. In humans, hippocampal damage results in profound impairments in episodic memory with relative preservation of other functions in a way that is remarkably similar to an episode of an alcoholic blackout [10,31,33].
The molecular mechanisms of the effects of alcohol on the hippocampus are not clear. However, one leading candidate for a cellular substrate of memory formation is long-term potentiation (LTP), which is the establishment of long lasting heightened responsiveness to signals from other cells [7,34,35]. Alcohol inhibits establishment of LTP by potently antagonizing N-methyl-D-aspartate (NMDA) receptor activity [32,36,37]. The NMDA receptor is necessary for LTP induction in area CA1 of the hippocampus. Ethanol’s effect on LTP in area CA1 of the hippocampus is thought to involve both inhibition of the NMDA receptor and potentiation of the ?-aminobutyric acid A (GABAA) receptor transmission, which leads indirectly to further NMDA receptor inhibition [7,35,36].
Theories proposing that alcohol-related amnesia is a result of state-dependent effects of alcohol suggest that forgotten memories of events during intoxication may be recalled by returning to that intoxicated state [18]. However, in a study on fragmentary blackouts, participants that experienced fragmentary blackouts exhibited poor recall even after returning to an intoxicated state [38]. Although alcohol may act as a subjective, physiologic cue [2], a much more influential effect is its impairment of encoding [7,38].
Nevertheless, memory formation and retrieval are also influenced by other cognitive factors such as attention and motivation [39]. Some studies suggest that alcohol may have detrimental effects on certain aspects of retrieval [2]. A recent animal research paper showed that alcohol can cause retrograde memory impairments. Rats were allowed to learn while sober, but if that learning was followed by a very high dose of alcohol, then the next day or two they showed severe memory impairment. This suggests that blackouts are not always due to deficits in encoding, attention or other memory-related processes but also can be due to consolidation or retrieval impairments. The implication is that, for example, a person might be sober during an episode such as a conversation with someone, but then if this is followed by binge drinking this conversation might not be remembered even though there was no alcohol on board at the time. This retrograde amnesia was found to be prevented by caffeine and related agents, implicating the adenosine A2A receptor and phosphodiesterase [40]. The inconsistent study results underscore the need for further investigation to elucidate the role of alcohol in the development of blackouts.
6. Treatment Implications
Conventionally, an alcohol-induced blackout has been thought to be an essential early warning sign of problematic drinking, occurring very rarely in non-alcoholics. Previously, blackouts were ranked among the top three indicators of alcoholism, its course remaining relatively stable over time [3]. Although now it is clear that blackouts are not limited to alcoholics, it is a strong indicator of rapid and excessive drinking. A great majority of alcoholics experience blackouts during the early phase of addiction [41]. Even in young social drinkers, those that experience blackouts are characterized by more days of drinking, frequent heavy drinking, and a greater number of drinks per day. The influence of heavy drinking on the blackout incidence is even more compelling considering the fact that heavy drinkers are known to minimize self-reported estimates of drinking [9].
Although the alcohol-induced blackout itself may not be an indicator of progressive alcohol dependence, the way in which an individual views the experience of a blackout may be influential in determining future drinking behavior. Social learning theory implies that drinking patterns are maintained by biased beliefs about alcohol and one’s own behavior [2,42,43]. Among college students that experienced alcoholic blackouts, the majority was frightened by the amnesia and as a result decreased their intake of alcohol. Failure to appropriately modify drinking behavior after a blackout, in other words, chronic blackouts, may be a serious sign of alcoholism [4]. One’s drinking experience should play a role in determining one’s alcohol expectancy, but limited recall of events associated with intoxication may confuse one’s bases for outcome expectancies [2]. Alcohol’s initial effects are euphoria, which is then followed by more sedative effects [2,44,45]. It is reported that positive effects of alcohol occur more reliably among heavy drinkers [46] and that these positive effects occur at lower BAC [44]. Accordingly, positive expectancies are generally endorsed more strongly by heavy drinkers [47]. The variant aldehyde dehydrogenase 2 gene allele (ALDH2*2) is well known to be associated with negative physiological responses in normal samples in past research. A recent study showed, however, that the psychological expectancies associated with drinking are more positive and less negative in persons with alcoholism that have the ALDH2*1/*2 genotype [48]. This result implies that the positive expectancies associated with drinking alcohol appear to override the usual discomfort or negative effects associated with protection against drinking alcohol. Blackouts are associated with rising BAC, and recall of a drinking episode may reflect the initial positive effects better than the later negative effects. Those experiencing fragmentary blackouts have been reported to perceive a greater likelihood of positive alcohol effects compared to those who have not experienced blackouts, indicating that memory impairment during intoxication may produce a cognitive bias with regard to the alcohol associated experiences.
In addition, those reporting en bloc blackouts had strong positive alcohol expectancies [2].
As mentioned above, the alcoholic blackout is a sign of brain dysfunction that results in memory impairment. In order to prevent alcohol-induced blackouts, the following is recommended: drink alcohol slowly, drink modestly, drink infrequently, drink with side dishes, and abstinence or moderation in drinking is especially important in high-risk groups, that is, persons with a large number of alcoholic relatives. Since alcoholic blackouts occur early in the course of disease and the blackout itself may act to facilitate problematic drinking resulting in another blackout, psychoeducation targeting episodes of alcoholic blackouts may be effective in preventing further episodes and the evolution to full-blown alcoholism.
Acknowledgments
This study was supported by a grant of the Korea Healthcare technology R&D Project, Ministry for Health, Welfare & Family Affairs, Republic of Korea (5-2009-A0048-00060).
Large observational studies have found beneficial cardiovascular effects with moderate alcohol consumption.
The effect of alcohol consumption on the cardiovascular system has been the source of much debate over the past few years. Heavy alcohol consumption is associated with detrimental effects on many of the body’s systems, as well as with an increased risk of addiction, motor vehicle accidents, trauma, violence, cancer, and suicide. However, large epidemiological studies also point to a multitude of potential beneficial effects with chronic moderate alcohol consumption – defined here as up to two standard alcoholic drinks (44 mL spirits, 148 mL wine, or 355 mL beer) per day for men and up to one drink per day for women. Observational studies have compared subjects abstaining from alcohol with subjects consuming alcohol and found differences in all-cause mortality and mortality due to cancer, stroke, and coronary artery disease. Despite some adverse effects on arrhythmogenesis and blood pressure, alcohol has been found to generally benefit vascular health and to lower the risk of coronary artery disease. Evidence regarding the effects of alcohol on the cardiovascular system indicates that moderate consumption of up to two drinks per day for men and one drink per day for women is associated with the greatest potential benefit at the lowest overall risk. However, randomised controlled trials are still needed to determine whether the observed associations result from alcohol consumption alone and whether the benefit found relates to the kind of alcoholic beverage consumed.
Heavy alcohol consumption is associated with detrimental effects on many of the body’s systems, as well as with an increased risk of addiction, motor vehicle accidents, trauma, violence, cancer, and suicide. However, large epidemiological studies also point to a multitude of beneficial effects with chronic moderate alcohol consumption. Evidence regarding the effect of surrounding moderate alcohol consumption on the cardiovascular (CV) system is well worth considering.
Definitions
Many different definitions are used in the literature for a “standard” drink and “moderate” alcohol consumption. In this article we use the Department of Health and Human Services and the US Department of Agriculture definition for a standard drink, which is 17.74 mL or 14 g of alcohol. This represents 44 mL (1.5 fl. oz.) of 80-proof spirits, 148 mL (5 fl. oz.) of wine, or 355 mL (12 fl. oz.) of beer. Moderate alcohol consumption is defined in the same guideline as up to two alcoholic drinks per day for men and up to one alcoholic drink per day for women.
Alcohol and mortality
The relationship between alcohol consumption and all-cause mortality has been found to conform to a J-shaped curve, which is attributed to a combination of the beneficial and harmful effects of chronic alcohol consumption. This was clearly demonstrated in a large meta-analysis involving the study of over 1 million subjects.[1] The greatest benefit on all-cause mortality was observed in subjects consuming 6 g of alcohol per day (approximately half a drink per day), while parity with abstainers was reached with subjects consuming around 44 g per day (approximately three drinks per day). Thereafter, higher levels of alcohol consumption were associated with an increase in all-cause mortality.
While both sexes benefitted from chronic alcohol consumption, the authors noted a gender difference with respect to degree of benefit and level of consumption. Although the observed maximum protection of alcohol was similar between the sexes (18% in women and 17% in men) the slopes of the two curves differed, as seen in Figure 1. Whereas up to three drinks per day remained protective in men, women only derived benefit if they consumed less than two drinks per day.
Multiple studies have attempted to subquantify the effect of alcohol consumption on the various modalities of death with remarkably similar results. When taken together, the risk of dying a cardiovascular death appears to conform to an inverse or L-shaped mortality curve, with apparent risk reductions even with consumption of more than two drinks per day.[2,3] The beneficial effects of increasing alcohol consumption on cardiovascular mortality seem to apply to most subtypes of cardiovascular disease, and are generalisable to the elderly and those with a lower baseline risk or type 2 diabetes.[2-4]
Unfortunately, the cardiovascular benefit of increasing alcohol consumption is offset by an increase in noncardiovascular death.[2,3] Specifically, there is a significant association between increasing alcohol consumption and risk of death from cirrhosis, trauma, and cancer (Figure 2).[2,3] Not surprisingly, alcohol-related cancers (mouth, esophagus, pharynx, larynx, and liver) increase in frequency with increasing consumption (RR 1.5 for two to three drinks per day [confidence interval (CI) 1.1–2.1 for men and 0.9–2.5 for women]; RR 2.8 [CI 2.1–3.8] in men and 3.0 [CI 1.7–5.3] for women for more than four drinks per day). Somewhat unexpectedly, there was an observed increase in breast cancer mortality for women who consumed even one drink per day (RR 1.3 [CI 1.1–2.6]). There was no observed relationship between colon cancer risk and alcohol consumption.[2]
When compared with either heavy consumption or abstinence, moderate alcohol consumption is associated with a lower risk of all-cause mortality. With increasing consumption, the risk of cardiac mortality continues to decrease, but the risk of noncardiac mortality (hemorrhagic stroke, cancer, cirrhosis, trauma) increases. The benefit of moderate alcohol consumption applies to the middle-aged and the elderly, as well as to those with diabetes. A gender difference exists, with women deriving less benefit than men at increasing levels of alcohol consumption.
Alcohol and arrhythmia
The association between alcohol consumption and arrhythmia has long been described, with acute episodes of “holiday heart” (acute rhythm disturbance) occurring in association with episodes of binge drinking. But what of the risk of atrial fibrillation with chronic alcohol consumption? The literature on this topic suggests that the higher risk is confined to heavy drinking, although the threshold of risk differs between studies.[5,6] After adjusting for confounders, the Framingham study demonstrated a 34% increase in the risk of developing atrial fibrillation or flutter with consumption of more than 2.5 alcoholic drinks per day, while data from the Copenhagen City Heart Study suggest the risk of atrial fibrillation only increases with consumption above five drinks per day (hazard ratio 1.45 [CI 1.02–2.04]).5, Neither of these studies demonstrated a significant association between alcohol consumption and atrial fibrillation in women, although the reason for this remains unclear.
In terms of ventricular arrhythmias, there is a known association between heavy alcohol consumption and sudden cardiac death.[7] However, as with all-cause mortality, the risk of sudden cardiac death appears to decrease with moderate alcohol consumption.[8] After adjusting for confounders of sudden cardiac death, there was an observed U-shaped curve describing the relationship between alcohol consumption and sudden cardiac death, with significantly reduced risk in men who consumed two to four drinks per week (RR 0.4 [CI 0.22–0.75]) and five to six drinks per week (RR 0.21 [CI 0.08–0.56]) compared with men who rarely or never consumed alcohol. With two or more drinks per day the relationship approached unity.
Alcohol is proposed to increase arrhythmogenesis by way of the hyperadrenergic state of drinking and withdrawal, as well as by way of associated proarrhythmic electrolyte abnormalities such as hypomagnesemia. Likewise, alcohol is known to impair vagal heart rate control, and prolong the QT interval. Most of these effects are observed at high levels of consumption. Therefore, at lower levels of consumption the arrhythmogenic effect of alcohol is minimal and is largely outweighed by the other beneficial effects that alcohol can have on overall vascular health.
Alcohol and CV risk factors
The proposed benefits of chronic moderate alcohol consumption are thought to derive from the effects of alcohol on overall vascular health. Specifically, studies have shown that regular moderate alcohol consumption is associated with improved endothelial function, reductions in inflammation, plasma viscosity and platelet aggregation, as well as induction of a favourable lipid profile.9-12 Some of these effects are almost instant (such as the increase in serum HDL-C within 1 hour of alcohol consumption), whereas others appear to be long lasting even without regular consumption (such as the lowered plasma viscosity even after 3 weeks of abstinence).[13,14]
But not all cardiovascular risk factors are affected equally. Specifically, the adverse role of alcohol on blood pressure is well described. The Canadian Hypertension Society estimates that 4.0% to 9.2% of Canadian men and 0.6% to 2.6% of Canadian women have hypertension attributable to alcohol consumption.[15] In the large INTERSALT trial, consumption of three to five drinks per day was associated with a 2.7/1.6 mm Hg rise in blood pressure in men and 3.9/3.1 mm Hg in women. For men, blood pressure increased by 4.6/3.0 mm Hg for five or more drinks per day.[16] Whereas moderate alcohol consumption was not associated with an increased risk of high blood pressure in the INTERSALT trial, a recent Mendelian randomised trial showed an estimated 0.24 mm Hg rise in systolic blood pressure per gram of alcohol consumed daily (3.36 mm Hg per drink per day).17 That being said, a study of 14 125 known hypertensive men showed that the risk of all-cause mortality and cardiovascular mortality decreased with moderate alcohol consumption when subjects were compared with abstainers (multivariate RR 0.56).[18]
Alcohol and CAD
The role of moderate alcohol consumption has also been examined with respect to the risk for developing coronary artery disease (CAD). In a prospective study of over 20 000 apparently healthy men, moderate alcohol consumption had a strong, independent, inverse association with the risk of developing angina pectoris (RR 0.69 [CI 0.59–0.81]) or sustaining a myocardial infarction (RR 0.65 [CI 0.52–0.81]).[19] This observation appears to be independent of baseline CV risk with similar trends observed in the healthiest subset of the Health Professionals Follow-Up Study.[20]
Even when CAD is established, moderate alcohol consumption continues to be associated with improved outcomes. In a study of over 2100 subjects consecutively undergoing coronary angiography, moderate alcohol consumption was the only negative predictor of cardiac mortality over a median follow-up of 93 months (hazard ratio 0.84 [CI 0.71–1.0]).[21] Likewise, in patients followed after coronary artery bypass grafting, moderate alcohol consumption was associated with a nonsignificant trend toward less angiographic progression (odds ratio 0.7 [CI 0.4–1.1]) and fewer clinical events—death, MI, stroke, bypass surgery, or angioplasty (hazard ratio 0.7 [CI 0.5–1.1]).[22]
In patients with acute coronary syndrome, chronic alcohol consumption appears to play a favourable role, perhaps secondary to the aforementioned beneficial platelet aggregation and blood viscosity effects. After adjusting for propensity to drink and other confounders, increasing alcohol consumption over the year prior to MI remained predictive of lower total and cardiovascular mortality (adjusted hazard ratio 0.79 for less than one drink per day [CI 0.6–1.3], and adjusted hazard ratio 0.68 for one drink or more per day. [CI 0.45–1.05]).[23]
Alcohol and heart failure
It is well known that heavy alcohol consumption is associated with significant abnormalities in both systolic and diastolic function.[24] This same observation does not necessarily hold true for moderate levels of alcohol consumption, based on multiple large observational trials where subjects who consumed moderate levels of alcohol were compared with abstainers and found to have a lower incidence of symptomatic heart failure (adjusted RR 0.41–0.66 for one drink per day).[25,26] In patients with established heart failure the benefits of ongoing moderate alcohol consumption are dependent on the underlying cause of cardiomyopathy. A recent analysis of the SOLVD (Studies of Left-Ventricular Dysfunction) cohort examined patients with predominantly NYHA functional class I and II ischemic and nonischemic cardiomyopathy with a left ventricular ejection fraction of less than 35%. The authors demonstrated that moderate alcohol consumption significantly decreased all-cause, noncardiovascular, and MI-related mortality in the ischemic but not idiopathic dilated cardiomyopathy population over an average of 3 years of follow-up.[27]
Up to this point we have not discussed the role of chronic alcohol consumption in alcoholic cardiomyopathy, a specific form of dilated cardiomyopathy related to longstanding heavy alcohol use (5 to 20 years of more than six drinks per day). Conventional wisdom has been that alcoholics with alcohol-induced cardiomyopathy must abstain from alcohol. This assertion was supported by a study showing improved ejection fraction and 7-year transplant-free survival in those who completely abstained (45%) versus those who continued to abuse alcohol (27%).[28] However, a separate study of alcohol abusers (more than seven drinks per day for more than 10 years) with established alcohol-induced cardiomyopathy demonstrated comparable persistent improvements in ejection fraction when those who were able to moderate their drinking (less than four drinks per day) were compared with abstinent subjects. The improvement in ejection fraction was blunted in those consuming four to six drinks per day, and continued consumption more than six drinks per day resulted in progressive ejection fraction deterioration.[29]
Caveats
Detractors may question the ability of studies using self-reported data to accurately estimate consumption and adequately control for confounders such as social status and access to health care. While only observational in nature, these studies did attempt to address these concerns. First, it is known that self-reported alcohol consumption is generally reliable, particularly regarding mild to moderate levels of consumption. Although heavy drinkers have a tendency to underreport their consumption, inadvertently including their data with the mild-to-moderate group would only serve to cause an underestimation of the beneficial effects of moderate levels of consumption. Second, we know that levels of moderate alcohol consumption tend to remain reasonably stable over time, with 95% of nondrinkers continuing to abstain or drink less than two drinks per week 10 years after enrollment.[2] Likewise, 78% of the current drinkers remained in the same or adjacent (usually lower) category of consumption. Lastly, nearly all of the included observational studies made adjustments for common confounders, and the adjusted relative risks and odds ratios are those that are reported here. Another criticism of the mostly large-scale, cross-cultural observational studies described here cannot be addressed so easily. Unfortunately, these types of studies are based on the false assumption that culturally or genetically diverse populations have similar susceptibilities to environmental factors. Despite a pressing need for randomised control trials, these have yet to be performed, so it is unclear whether the observed associations result from factors other than alcohol consumption.
Yet another concern about most of the evidence presented here relates to the fact that only ongoing, chronic consumption is considered. This means we have limited knowledge regarding the potential benefits of initiating moderate alcohol consumption in abstainers. A recent study from 2008 showed that after four years of follow-up, new light-to-moderate drinkers (up to two drinks per day in men, up to one drink per day in women) had a 38% reduction in their chance of developing CV disease when compared with persistent abstainers. This difference remained after adjustment for demographic and CV risk factors (odds ratio 0.62 [CI 0.4–0.95]). However, over this limited follow-up period there was no difference in mortality between the new drinkers and persistent abstainers.[30]
Last, the question has been raised regarding whether it matters what you drink. While the results of some mainly European studies suggest that the benefit lies exclusively in consumption of wine, a large American study of nearly 40 000 subjects did not find any difference in type of beverage consumed and myocardial infarction risk after 12 years of follow-up.[31] Further studies are needed to clarify this issue.
Conclusions
Observational studies completed to date indicate that the potential benefits of alcohol consumption depend on the level of intake as well as the specific body system and outcome being examined. While cardiovascular benefit may be observed with increasing consumption, heavy consumption is associated with detrimental noncardiovascular outcomes. As such, based on the current state of evidence, for the average individual, consumption of up to two drinks per day for men and one drink per day for women is associated with the greatest potential cardiovascular benefit at the lowest overall risk. Randomised controlled trials are still needed, however, to determine whether the observed associations result from alcohol consumption alone and whether the benefit found relates to the kind of alcoholic beverage consumed.
Competing interests
None declared.
References
1. Di Castelnuovo A, Costanzo S, Bagnardi V, et al. Alcohol dosing and total mortality in men and women: An updated meta-analysis of 34 prospective studies. Arch Intern Med 2006;166:2437-2445. Full Text
2. Thun MJ, Peto R, Lopez AD, et al. Alcohol consumption and mortality among middle-aged and elderly U.S. adults. N Engl J Med 1997;357:1705-1714. Full Text
3. Goldberg RJ, Burchfiel CM, Reed DM, et al. A prospective study of the health effects of alcohol consumption in middle-aged and elderly men. The Honolulu Heart Program. Circulation 1994;89:651-659. Full Text
4. Valmadrid CT, Klein R, Moss SE, et al. Alcohol intake and the risk of coronary heart disease mortality in persons with older-onset diabetes mellitus. JAMA 1999;282:239-246. Full Text
5. Djoussé L, Levy D, Benjamin EJ, et al. Long-term alcohol consumption and the risk of atrial fibrillation in the Framingham Study. Am J Cardiol 2004;93:710-713. PubMed Abstract
6. Mukamal KJ, Tolstrup JS, Friberg J, et al. Alcohol consumption and risk of atrial fibrillation in men and women: The Copenhagen City Heart Study. Circulation 2005;112:1736-1742. Full Text
7. Wannamethee G, Shaper AG. Alcohol and sudden cardiac death. Br Heart J 1992;68:443-448. Full Text
8. Albert CM, Manson JE, Cook NR, et al. Moderate alcohol consumption and the risk of sudden cardiac death among US male physicians. Circulation 1999;100:944-950. Full Text
9. Teragawa H, Fukuda Y, Matsuda K, et al. Effect of alcohol consumption on endothelial function in men with coronary artery disease. Atherosclerosis 2002;165:145-152. PubMed Abstract
10. Imhof A, Woodward M, Doering A, et al. Overall alcohol intake, beer, wine, and systemic markers of in?ammation in western Europe: Results from three MONICA samples (Augsburg, Glasgow, Lille). Eur Heart J 2004;25:2092-2100. Full Text
11. de Lorgeril M, Salen P. Wine ethanol, platelets, and Mediterranean diet. Lancet 1999;353:1067. PubMed Abstract
12. Suh I, Shaten BJ, Cutler JA, et al. Alcohol use and mortality from coronary heart disease: The role of high-density lipoprotein cholesterol. Ann Intern Med 1992;116:881-887. Full Text
13. Veenstra J, Ockhuizen T, van de Pol H, et al. Effects of a moderate dose of alcohol on blood lipids and lipoproteins postprandially and in the fasting state. Alcohol Alcohol 1990;25:371-377. Abstract
14. Jensen T, Retterstøl LJ, Sandset PM, et al. A daily glass of red wine induces a prolonged reduction in plasma viscosity: A randomized controlled trial. Blood Coagul Fibrinolysis 2006;17:471-476. PubMed Abstract
15. Campbell NR, Ashley MJ, Carruthers SG, et al. Lifestyle modifications to prevent and control hypertension. 3. Recommendations on alcohol consumption. Canadian Hypertension Society, Canadian Coalition for High Blood Pressure Prevention and Control, Laboratory Centre for Disease Control at Health Canada, Heart and Stroke Foundation of Canada. CMAJ 1999;160(9 suppl):S13-S20. Full Text
16. Marmot MG, Elliott P, Shipley MJ, et al. Alcohol and blood pressure: The INTERSALT study. BMJ 1994;308:1263-1267. Full Text
17. Chen L, Davey Smith G, Harbord RM, et al. Alcohol intake and blood pressure: A systematic review implementing a mendelian randomization approach. PLoS Med 2008;5:e52. Full Text
18. Malinski MK, Sesso HD, Lopez-Jimenez F, et al. Alcohol consumption and cardiovascular disease mortality in hypertensive men. Arch Intern Med 2004;164:623-628. Full Text
19. Camargo Jr CA, Stampfer MJ, Glynn RJ, et al. Moderate alcohol consumption and risk for angina pectoris or myocardial infarction in U.S. male physicians. Ann Intern Med 1997;126:372-375. PubMed Abstract
20. Mukamal KJ, Chiuve SE, Rimm EB. Alcohol consumption and risk for coronary heart disease in men with healthy lifestyles. Arch Intern Med 2006;166:2145-2150. Full Text
21. Femia R, Natali A, L’Abbate A, et al. Coronary atherosclerosis and alcohol consumption: Angiographic and mortality data. Arterioscler Thromb Vasc Biol 2006;26:1607. Full Text
22. Mukamal KJ, Girotra S, Mittleman MA. Alcohol consumption, atherosclerotic progression, and prognosis among patients with coronary artery bypass grafts. Am Heart J 2006;151:368-372. PubMed Abstract
23. Mukamal KJ, Maclure M, Muller JE, et al. Prior alcohol consumption and mortality following acute myocardial infarction. JAMA 2001;285:1965-1970. Full Text
24. Lazarevic AM, Nakatani S, Neskovic AN, et al. Early changes in left ventricular function in chronic asymptomatic alcoholics: Relation to the duration of heavy drinking. J Am Coll Cardiol 2000;35:1599-1606. PubMed Abstract
25. Walsh CR, Larson MG, Evans JC, et al. Alcohol consumption and risk for congestive heart failure in the Framingham Heart Study. Ann Intern Med 2002;136:181-191. PubMed Abstract
26. Djoussé L, Gaziano JM. Alcohol consumption and risk of heart failure in the Physicians’ Heath Study I. Circulation 2007;115:34-39. Full Text
27. Cooper HA, Exner DV, Domanski MJ. Light-to-moderate alcohol consumption and prognosis in patients with left ventricular systolic dysfunction. J Am Coll Cardiol 2000;35:1753-1759. PubMed Abstract
28. Gavazzi A, De Maria R, Parolini M, et al. Alcohol abuse and dilated cardiomyopathy in men. Am J Cardiol 2000;85:1114-1118. PubMed Abstract
29. Nicolas JM, Fernandez-Sola J, Estruch R, et al. The effect of controlled drinking in alcoholic cardiomyopathy. Ann Intern Med 2002;136:192-200. PubMed Abstract
30. King DE, Mainous AG 3rd, Geesey ME. Adopting moderate alcohol consumption in middle age: Subsequent cardiovascular events. Am J Med 2008;121:201-206. Full Text
31. Mukamal KJ, Conigrave KM, Mittleman MA, et al. Roles of drinking pattern and type of alcohol consumed in coronary heart disease in men. N Eng J Med 2003;348:109-118.
Dr Andrade is a cardiology fellow at the University of British Columbia. Dr Gin is a clinical professor in the Department of Medicine at the University of British Columbia and director of the UBC postgraduate cardiology programme. He is also associate director of the Vancouver General Hospital cardiac care unit and echocardiography laboratory.
“Et bliev nix wie et wor” (“Nothing stays as it was”): that’s the wording of Article 5 in the Kölsch Constitution, a compilation of eleven idioms in the local dialect. And that also applies to the Cologne-based brewery Privatbrauerei Gaffel: capacities in its previous inner-city facility were exhausted – more space was urgently required. Needless to say, the family-managed brewery wanted to keep its independence and continue to produce efficiently. So Gaffel took a bold step towards an auspicious future – and merged its two breweries into a single plant.
It was not so very long ago that Privatbrauerei Gaffel was still operating two breweries: since 1908, it had been brewing its traditional Gaffel-Kölsch right in the heart of Cologne’s inner city, just a stone’s throw away from Cologne Cathedral. And in 1998, it then took over the Richmodis-Brauerei in the suburb of Porz-Gremberghoven. Kegs and “Pittermännchen” (10-litre Kölsch barrels), moreover, are filled in Cologne’s northern Bilderstöckchen district. Gaffel has always had its bottles contract-filled.
But it was precisely this inner-city location that entailed a few problems: Supplying the brewery with raw materials and expendables, as well as tanker-truck traffic, grew into a progressively more difficult logistical challenge; The space constraints entailed by the fact that the building complex was located in the middle of a street near Cologne’s main station did not permit any expansion. On a mere 2,000 square metres, Gaffel was brewing almost half a million hectolitres a year.
So there was only one logical consequence for Gaffel: to merge its three facilities into one in the medium term. The premises of what used to be the Richmodis Brewery were downright predestined for this plan. Not only was the autobahn only a short distance away but the existing infrastructure was likewise well-nigh ideal: the production facility is situated in a designated industrial estate – there are no problems about producing round the clock there. What’s more, the premises possess their own deep well with certified water rights. So this was a no-brainer.
Turnkey solution
No sooner said than done. Back in 2012, Gaffel had already started to make plans for the relocation, put it out to tender in the normal way among the vendors of brewery process technology – and in the end opted for Krones. “It was not really the most favourable quotation but it definitely was the best overall technical solution,” says Reiner Radke, Technology and Logistics Director, and emphasises a few major points in addition: “We’re largely using Evoguard double-seat valves throughout our production operation. These are substantially smaller than competitors’ models, and all the components
can be replaced without having to use special tools. Similar considerations apply for the Evoguard pumps, which additionally consume less energy than comparable units. What’s more, our staff were already familiar with Krones equipment: the existing Richmodis brewhouse was from Steinecker, and in our Eigelstein facility we’d already been using the Botec F1 process control system with integrated Siemens-S7 technology.”
So Gaffel placed an order with Krones for a turnkey solution, except for the new boiler house, which the brewery installed itself. Gaffel wanted to keep on using some of the existing Richmodis kit, and supplement this with new units. The only components that Gaffel took along from its original brewery in the heart of Cologne were a sheet filter and Steinecker’s TFS filtration system. “We wanted to keep the sheet filter because we’re filling in cold-sterile mode – no flash pasteurisation even, let alone pasteurisation proper,” explains Reiner Radke. “We took a deliberate decision against membrane filtration for a variety of reasons, one of them being that we’re assuming we’ll be able to run the TFS with cellulose instead of diatomite in the not too distant future.”
35 per cent less thermal energy
As far as energy savings were concerned, particularly, the new brewhouse provided Gaffel with quite a few advantages: The decision taken in favour of the EquiTherm energy recovery system made a crucial contribution towards reducing energy consumption at Gaffel’s new brewery – down by around 35 per cent for thermal energy and by about 30 per cent for electricity, in each case referenced to one hectolitre. “In terms of energy-efficiency, the EquiTherm is second to none. What’s more, the thermal impact on the mash during heat-up is small,” is Reiner Radke’s verdict. “Our energy-utilisation figures are in equilibrium: all of the thermal energy we’re producing is also consumed. At the same time, the technical outlay required to achieve this was manageable.”
The new boiler house likewise makes its contribution towards saving energy: it was possible to almost halve the previous figure for steam consumption of around ten tons of steam per hour.
Gaffel can now use solely natural gas, which is usually more affordable. What’s more, the central CIP system has a positive effect on energy consumption. Its centralisation, separated for unfiltrate and filtrate, has made for a reduction in the range of cleaning agents and disinfectants required. Gaffel is now using only caustic soda solution and nitric/phosphoric acid as cleaning agents, and peracetic acid as a disinfectant. The brewery does entirely without chlorine-based products or similar agents. “This simplifies our handling routines, reduces consumption and has less of an impact on the wastewater,” says Reiner Radke. Inductive flow meters have been installed in every department for measuring consumption levels, thus making sure that these latter can be accurately assigned and checked. Outside the central chemicals store Krones built a discharge station, so as to secure the wastewater against possible disasters.
Fermentation and storage cellar expanded
Gaffel likewise had its capacities for bright-beer, fermentation and storage tanks expanded by Krones in one go. In its old facility, the brewery had still worked with open fermentation and bitter foam on the green beer wort. It is now changing over to the two-tank fermentation process in cylindro-conical tanks. Needless to say, the brewery wanted to keep the high quality standards at their excellent levels. And the sampling tests proved that this had actually been achieved: “The customers didn’t even notice that we’d relocated – they were able to continue to relish the excellent taste of Gaffel-Kölsch that they’d been used to,” explains Reiner Radke. “We supplied the 2016 Cologne carnival season still from the old brewery. After that, we discontinued production there, relocated the filtration system to the new brewery, and started production here more or less seamlessly – without having to blend old beer stocks with freshly brewed beer.” And taking delivery of the new tanks likewise went off without a hitch. “The new cylindro-conical tanks are about 22 metres high and six metres in diameter. That was the maximum size we were able to transport from the banks of the Rhine through Cologne – but it worked,” explains Reiner Radke. “One of the major advantages here was that the tanks arrived in fully insulated condition on site, where they were placed on steel support frames. All that needed to be done after that was to link them up to each other.”
Central filtering-aid management
Filtering aids and stabilising agents are managed centrally at Gaffel. Krones installed a big-bag system with weighing-cell technology, dosing unit and initial blending tank. Dosing and initial blending have been fully automated. The staff use a crane to suspend the new big bags as needed, and other than that have no contact with the diatomite. “This increases occupational safety and reduces possible health risks. In a modern-day brewing operation, there is less and less physical work to do, what we need here nowadays is the staff’s intellectual input,” says Reiner Radke.
Krones likewise supplied a new diatomite disposal tank, a carbonation system and a water deaeration system for the filter cellar. The Hydronomic water treatment system consists of a manganese-removal module, an activated-carbon filter and a reverse-osmosis system. These components treat the water extracted from the brewery’s own deep well. Gaffel likewise had a ventilation system installed centrally for the entire brewery, tasked with preventing mould formation. All sections of the brewery are run from two control centres, featuring a redundant Krones Botec F1 system for managing the process. The vector-based, zoomable, graphical interfaces have been designed for intuitive operator control: each employee can configure the individual modules for program control on a screen window at his/her own discretion, using multiple displays (dashboard function).
Good cooperation
At peak times, up to 90 fitters were working on site. The safety precautions taken certainly paid off: during all of that time, there was not a single workplace accident.
It is now possible to operate the brewery in three shifts with only ten employees, six of whom are working in production and four in quality assurance. “Theoretically, we’d be able to run the brewery with one operator per shift, if it weren’t for the tanker-truck and container traffic,” explains Reiner Radke. “Our cooperation with Krones was good and professional, and since a project of this kind does of course also change over time it was important that both sides adopted a flexible stance when it came to any modifications required. Any difficulties cropping up were dealt with satisfactorily for both parties, any differences of opinion equitably resolved. Line erection proceeded on schedule as planned.”
Article 10 of the Kölsch Constitution reads: “Drinks de ejne met?” (“Like to have a drink with us?”) – Reiner Radke’s answer to this question can meanwhile be a confident “Yes”, now that this project has been successfully concluded.
Gluten-Free Spirits and Drinks
Alcoholic beverages are those containing more than 0,5% (vol/vol) of alcohol. They can be obtained by various processes (fermentation, addition, distillation, extraction, etc.). As there is no established classification of alcoholic beverages, alcoholic concentration is the most commonly used: 1) fermented alcoholic beverages such as beer, cider and wine, and 2) distilled beverages and spirits (higher in alcoholic concentration).
Antioxidant Activity and Phenolic Content of Apple Cider
Nilgün Havva Budak1*, Filiz Ozçelik2 , Zeynep Banu Güzel-Seydim3
1 Department of Food Processing, E?irdir Vocational School, Süleyman Demirel University, 32500 E?irdir/Isparta, Turkey
2 Department of Food Engineering, Faculty of Engineering, Ankara University, 06100 Ankara, Turkey 3 Department of Food Engineering, Faculty of Engineering, Süleyman Demirel University, 32260 Isparta, Turkey A R T I C L E I N F O
A B S T R A C T
Fruit and vegetables are an important component of a healthy diet and the main antioxidant suppliers in the human diet. Consumption of foods derived from fruits and vegetables is also essential; fruit juices, ciders, wines, and vinegars also contain significant amounts of polyphenolic compounds. The aim of the study was to determine the effect maceration of antioxidant activity and phenolic content of apple cider. Red delicious apples were used to produce natural apple cider with and without inclusion of maceration. Samples were taken from fresh red apple juice, macerated samples and apple cider. Apple cider (maceration was applied) (CAM) had the highest total phenolic content, chlorogenic acid, ORAC and TEAC levels. Chlorogenic acid was the dominant phenolic substance in apple juice and cider samples and chlorogenic acid was increased with maceration process. Keywords: Apple cider Chlorogenic acid Maceration ORAC TEAC Introduction Fruit and vegetables are an important component of a healthy diet and, if consumed daily in sufficient amounts, could help prevent major diseases such as cardiovascular diseases (CVDs) and certain cancers. Noncommunicable diseases (NCDs), especially cardiovascular diseases (CVDs), cancer, obesity and diabetes, currently kill more people every year than any other cause of death. The recent Joint FAO/WHO Expert Consultation on diet, nutrition and the prevention of chronic diseases, recommended the intake of a minimum of 400g of fruit and vegetables per day (excluding potatoes and other starchy plant) for the prevention of NCDs as well as for the prevention and alleviation of several micronutrient deficiencies, especially in less developed countries (WHO, 2003). Dietary intake of natural antioxidants has recently received increased attention due to the epidemiological evidence that correlates a regular intake of these products with protection against several diseases (Hertog et al., 1995). Fruits and vegetables are the main antioxidant suppliers in the human diet. Among them, apple is important not only for its high antioxidant content, but also for its acceptance among the general consumer population. Vinson et al. (2001) reported that 22% of the fruit phenolics consumed in the United States came from apple. Eberhardt et al. (2000) found that 100 g of fresh apples have an antioxidant activity equivalent to 1500 mg of vitamin C, and more important, that apple phenolic extracts inhibited proliferation of a human cancer cell line. The major antioxidants present in apple are polyphenols, which include phenolic acids (chlorogenic, cinammic, gallic acid, etc.) and flavonoids (catechin, quercetin, quercetin glycosides, etc.). Apple and apple products (juice, cider, vinegar) are commonly consumed worldwide. Apple polyphenols contain mainly polyphenolic acid derivatives and other flavonoids. Generally, these polyphenols are distributed in the whole fruit, with higher concentrations present in the peel rather than in the flesh (Wolfe et al., 2003). The complexation and antioxidant activity of the major apple polyphenols: Chlorogenic Acid (CA), Rutin (Rt) and Quercetin (Qc) with b-cyclodextrin (b-CD) were studied, by fluorescence spectroscopy and Ferric Reducing/Antioxidant Power Assay (FRAP) techniques (Alvarez-Parrilla et al., 2005). Budak et al. (2011) reported that chlorogenic acid is also commonly in apple cider vinegar. The aim of the study was to determine the effect of maceration on antioxidant activity and phenolic content level of ciders derived from red delicious apples during cider production. Red delicious apples were used to produce natural apple cider with and without inclusion of maceration.
Material and Methods
Material
“Red Delicious” apple was harvested in Gelendost, Isparta, and appropriately transported to Fermentation Laboratory in the Süleyman Demirel University Gelendost Vocational School (Isparta, Turkey).
Apple Cider Production
“Red delicious” apples were used to make natural apple cider to determine the effects of maceration. Flow scheme of apple cider production methods are presented in Figure 1. The samples were named as apple juice (AJ), apple juice sample taken after maceration (ASM), apple juice after fermentation without maceration sample (AS), apple cider (with maceration) (CAM) and apple cider sample (without maceration) (CA). Briefly, after red apples were broken into pieces maceration was carried out during seven days. Addition of 10% pomace was used in the maceration step to increase the polyphenolic contents. Apple cider was obtained after processing apple juice was fermented for two months.
Compositional Analysis
Total titratable acidity, density and total ash of apple juice and apple cider samples were determined according to AOAC methods (1992). Total sugar in apple juice and maceration samples were analyzed according to the Luff Schoorl methods (AOAC 1990). Water soluble solid (Brix) was measured with Abbe refractometer (Bellingham Stanley Limit 60/70 Refractometer, England). Ethanol content was determined with alcoholmeter (Dujardin-Salleron, France).
Total Antioxidant Activity
Total phenolic content: Total phenolic contents of the samples were determined according to Folin-Ciocalteu method using gallic acid as a standard (Singleton and Rossi, 1965; Singleton et al., 1999). After addition of Folin-Ciocalteu reagent to the sample solution it was allowed to react for 6 min. Reaction was stopped with using 1.50 mL of 20% sodium carbonate. The extracts were oxidized with Folin-Ciocalteu reagent, and the reaction was neutralized with sodium carbonate. The absorbance of the resulting blue colour was developed in 120 min in a dark place, and the absorbance was determined at 760 nm using a spectrophotometer (Shimadzu Scientific Instruments, Inc., Tokyo, Japan). The measurement was calculated using a standard curve of gallic acid and expressed as milligrams of gallic acid equivalents (GAE) L-1 . 2,2’-azinobis (3-ethlybenzthiazoline)-6-sulfonic acid (ABTS) Assay: 2,2’-azinobis (3-ethlybenzthiazolin-6- sulfonic acid) diammonium salt (ABTS+ ) radical cation was prepared by reacting 7 mM ABTS stock solution with 2.45 mM potassium persulfate (Re et al., 1999). ABTS+ inhibition against Trolox (6-hydroxy-2, 5, 7, 8- tetramethylchroman-2-carboxylic acid) was spectrophotometrically measured (Seeram et al., 2005).
Figure 1 Flow chart of apple cider (maceration was applied and was not applied) The concentration of the resulting blue-green ABTS radical solution was adjusted to an absorbance of 0.700 ± 0.020 at 734 nm in a spectrophotometer (Shimadzu Scientific Instruments, Inc., Tokyo, Japan). TEAC values of samples were calculated from the Trolox standard curve and expressed as Trolox equivalents (in ?mol/ml of sample). Oxygen Radical Absorbance Capacity (ORAC) Assay: All samples were analysis using the Oxygen Radical Absorbance Capacity (ORAC) (Wu et al., 2008). The samples were appropriately diluted with phosphate buffer (pH 7.4) for ORAC analysis. An aliquot (25 ?L) of the diluted sample, blank (phosphate buffer) or Trolox calibration solutions were added to a black, clear-bottom triplicate well in 96 well bottom reading microplate. After the addition of 150 µM flourescein stock solution (0,004 µM) to each well the microplate was incubated at 37 °C for 30 min. Then, 25 µL 2, 2’-Azobis (2-amidinopropane) Harvesting “Red Delicious” apples Appropriate transportation of the apples to the Fermentation Laboratory Breaking into pieces of apples Pressing Obtained Apple Juice (AJ) Resettle and Racked of apple wine Resettle and Racked of apple wine Maturation 2 months at 25°C Maturation 2 months at 25°C Packaging (CA) Packaging (CA) Ethanol Fermentation:Saccharomyc es cerevisiae (3 %) inoculation 7 days at 25 °C (AS) Maceration with pulp and Ethanol Fermentation: Saccharomyces cerevisiae (3 %) inoculation 7 days at 25 °C (ASM) Budak et al./ Turkish Journal of Agriculture – Food Science and Technology, 3(6): 356-360, 2015 358 dihydrochloride (AAPH) solution (153 mM) was added to start the reaction. The microplate reader was programmed to record the fluorescence reading with an excitationemission wavelength of 485 – 520 nm using software Gen 5 TM. Antioxidant activity was kinetically measured with Biotek Synergy™ HT Multi-Detection Microplate Reader (Winooski, Vermont, USA). Quantification of Phenolics by High Performance Liquid Chromatography: Phenolic compounds were evaluated by reversed-phase high performance liquid chromatography (RP-HPLC, Shimadzu Scientific Instruments, Kyoto, Japan). Phenolic compositions of the extracts were determined by a modified method of Schulz et al. (2001). Detection and quantification were carried out with a LC-10ADvp pump, SIL-10ADvp auto sampler, a Diode Array Detector, a CTO-10Avp column heater, SCL-10Avp system controller and DGU-14A degasser (Shimadzu Scientific Instruments, Kyoto, Japan). Separations were conducted at 30 ºC on Agilent® Eclipse XDB C-18 reversed-phase column (250 mm x 4.6 mm length, 5 µm particle size). The mobile phases were A:3.0% acetic acid in distilled water and B: methanol. Flow rate was 0.8 mL/min. Gallic acid, catechin, caffeic acid, chlorogenic acid, p-coumaric acid, ferulic acid, rutin, resveratrol and syringic acid were used as standard. Identification and quantitative analysis were done by comparison with standards. Statistics All data were reported as the mean and standard error. Results analyzed by using SPSS for Windows (version 17.0, SPSS Inc.). Apple cider production was repeated three times. Values represent means of triplicate repetition with parallels. The significance was established at P<0.05. Results and Discussion Composition analysis Total titratable acidity, density, Brix, total ash total sugar and alcohol in apple juices and apple cider samples are reported in Table 1. Total titratable acidity was increased during ethanol fermentation. Especially, total titratable acidity in the sample taken from maceration was significantly higher than the sample that maceration was not applied (P<0.05). Total titratable acidity values in Cashew juice and Golden Delicious fresh apple juice samples were 2.4 g/L and 2.88 g MA/L, respectively (Mohanty et al., 2006; Suárez-Jacobo et al., 2011). Density of the samples varied between 0.9987 -1.0517 g/cm3 . Density and Brix values were significantly decreased during alcohol fermentation due to the conversion of sugar to ethanol (P<0.05). Budak and Güzel-Seydim (2010) explained that total solids and Brix of samples significantly decreased after maceration due to pressing, resettling and racking during grape wine production. Brix of Cashew apple wine was found to be 2.0% (Mohanty et al., 2006). In our study, brix of the apple cider sample was 3.83%. Alcohol contents of apple cider samples were between 5.40-6.10 %. The total sugar contents were 144.24, 85.77, 95.56 g/L in AS, ASM and AS, respectively. Total sugar content also decreased due to the ethanol fermentation by Saccharomyces cerevisae (Budak and Güzel-Seydim, 2010). Total Antioxidant Activity Total phenolic content, TEAC and ORAC results express the total antioxidant activity in the samples. Total phenolic content (mg/L), TEAC (mmol/L) and ORAC(?mol/mL) values of samples are presented in Figures 2 and 3, respectively. AJ sample had the lowest total phenolic content whereas CAM sample had the highest total phenolic content among the samples (P<0.05). Seeram et al. (2008) reported that TEAC and ORAC value of apple juice samples ranged between 2.5- 6.2 ?mol of TE/mL and 2.7-4.3 ?mol/mL, respectively. Total phenolic contents of AS and CAM samples were 459.31 mg/L and 1026.74 mg/L, respectively (Figure 3). Lachman et al. (2006) determined that total phenolic content of apple juice samples obtained from different varieties were between 760.03- 1343 mg/L. In our study, total phenolic content of ASM and AS samples were 777.83 and 733.61 mg/L. Contents of TEAC, ORAC and total phenolic content in CAM sample was the highest in all samples. TEAC and ORAC values of CAM sample were 13.27 mmol/L and 9.84 µmol TE/mL, respectively. ORAC values of apple cider samples were the highest in all samples. Especially, ORAC values of CAM sample was the highest in all samples (Figure 3). Antioxidant activities of macerated juice samples and ciders were higher than the samples that maceration was not applied. Phenolic Substances Gallic acid, catechin, epicatechin, caffeic acid, chlorogenic acid, and p-coumaric acid were detected in apple juice and apple cider samples (Table 2). Contents of catechin, epicatechin, and chlorogenic acid were identified in all samples. Gallic acid only was detected in apple juice sample. The content of catechin in CAM sample was significantly higher than CA sample (P<0.05). The amount of epicatechin was 4.63 mg/L in CAM sample while CA sample contained 3.33 mg/L (P<0.05). Chlorogenic acid was the dominant phenolic substance in apple juice samples; especially, ASM and CAM samples had the highest content of chlorogenic acid (P<0.05). Chlorogenic acid significantly increased with maceration. p-Coumaric acid contents of apple cider samples ranged between 0.03 and 0.04 mg/L. AlvarezParilla et al. (2005) reported that chlorogenic acid is one of the important apple polyphenols. Chlorogenic acid, catechin, epicatechin, caffeic acid were high concentrations in apple cider that maceration was applied. Therefore, maceration process was important for the concentrations of the polyphenolic compounds. Polyphenolic content (chlorogenic acid, catechin, epicatechin and caffeic acid) of CAM sample had the highest values similar to antioxidant activity of CAM sample (total phenolic content, TEAC and ORAC contents). It has been reported that wine vinegars show an antioxidant capacity that is correlated with their polyphenolic content (Dávalos et al., 2005). In this study, phenolic substances were increased by fermentation. Budak et al./ Turkish Journal of Agriculture – Food Science and Technology, 3(6): 356-360, 2015 359 Table1 Composition Analysis of Samples Samples TTA1Total Density (g/cm3 ) Brix (%) Total sugar (g/L) Total Ash (g/L) Ethanol (v/v) AJ2 1.9±0.04a 1.0517±0.00a 11.67±1.42a 144.24±1.11a 1.9±0.01a – ASM3 2.3±0.03a 0.9999±0.00b 4.58±0.71b 85.77±3.26b 1.7±0.02a 3.10±0.14b AS4 3.7±0.06c 1.0014±0.00c 5.33±0.34b 95.56±0.41b 1.7±0.00b 2.90±0.12b CAM5 2.3±0.03a 0.9987±0.00b 3.83±0.83b – 1.9±0.01a 6.10±0.15a CA6 3.5±0.04c 0.9987±0.00c 3.83±0.13b – 1.8±0.01b 5.40±0.11b 1TTA: Total Titratable Acidity (g/L), 2AJ: Apple juice, 3ASM: Apple juice taken after maceration, 4AS: Apple juice without maceration sample, 5CAM: Apple cider (maceration was applied), 6CA: Apple cider sample (maceration was not applied) Table 2 Phenolic Compounds of Samples Samples Gallic acid (mg/L) Catechin (mg/L) Epicatechin (mg/L) Caffeic acid (mg/L) Chlorogenic acid (mg/L) p-Coumaric acid (mg/L) AJ1 0.43±0.06b 0.50±0.00c 1.60±0.10bc – 12.26±3.37c – ASM2 – 1.47±0.29b 3.50±0.78a 0.46±0.24ab 18.53±4.06a – AS3 – 1.56±0.13b 4.13±0.36a – 17.86±0.60b 0.05±0.01b CAM4 – 2.13±0.28a 4.63±1.20a 0.96±0.08a 24.13±3.46a 0.03±0.01b CA5 – 1.46±0.23b 3.33±0.23ab 0.75±0.05a 16.50±2.27b 0.04±0.00b 1AJ: Apple juice, 2ASM: Apple juice taken after maceration, 3AS: Apple juice without maceration sample, 4CAM: Apple cider (maceration was applied), 5CA: Apple cider sample (maceration was not applied) Figure 2 Total Phenolic Content of Apple Juices and Cider Samples AJ: Apple juice, ASM: Apple juice taken after maceration, AS: Apple juice without maceration sample, CAM: Apple cider (maceration was applied) , CA:Apple cider sample (maceration was not applied) Figure 3 Antioxidant activity of samples by ABTS (TEAC) assay and ORAC assay AJ: Apple juice, ASM: Apple juice taken after maceration, AS: Apple juice without maceration sample, CAM: Apple cider (maceration was applied) , CA: Apple cider sample (maceration was not applied) Conclusion This is the first report confirming that maceration had positive effects on bioactive components of apple cider. Results of this study showed that polyphenolic compounds and antioxidant activity significantly increased in maceration process. Antioxidant activity of apple cider (maceration included) sample was higher than that of apple cider sample (maceration was not applied). Chlorogenic acid was the dominant phenolic substance in apple juice samples while chlorogenic acid increased during maceration. Chlorogenic acid, catechin, epicatechin, caffeic acid contents of macerated apple cider were in high concentrations. Therefore, inclusion of maceration in process would be important for concentration of bioactive compounds. References Alvarez-Parrilla E, Rosa LDL, Torresrivas F, Rodrigo-Garcia J, Gonzalez’Lez-Aguilar GA. 2005. Complexation of Apple Antioxidants: Chlorogenic Acid, Quercetin and Rutin by bCyclodextrin (b-CD). J Incl Phenom Macro 53:121–129. AOAC. 1990. Association of Official Analytical Chemists. Official Methods of Analysis, 13th edition. Washington DC. AOAC. 1992. Association of Official Analytical Chemists. Official Methods of Analysis, 15th edition. Washington DC. Budak HN, Güzel-Seydim Z. 2010. Antioxidant activity and phenolic content of wine vinegars produced by two different techniques. J Sci Food Agric, 90: 2021–2026. Caponia F, Alloggio V, Gomes T. 1999. Phenolic compounds of virgin olive oil: influence of paste preparation techniques. Food Chem 63: 203-209. Eberhardt MV, Lee CY, Liu RH. 2000. Antioxidant activity of fresh apples. Nature. 405: 903-4. Budak et al./ Turkish Journal of Agriculture – Food Science and Technology, 3(6): 356-360, 2015 3