
With premiumisation on the rise value of exports is going up.
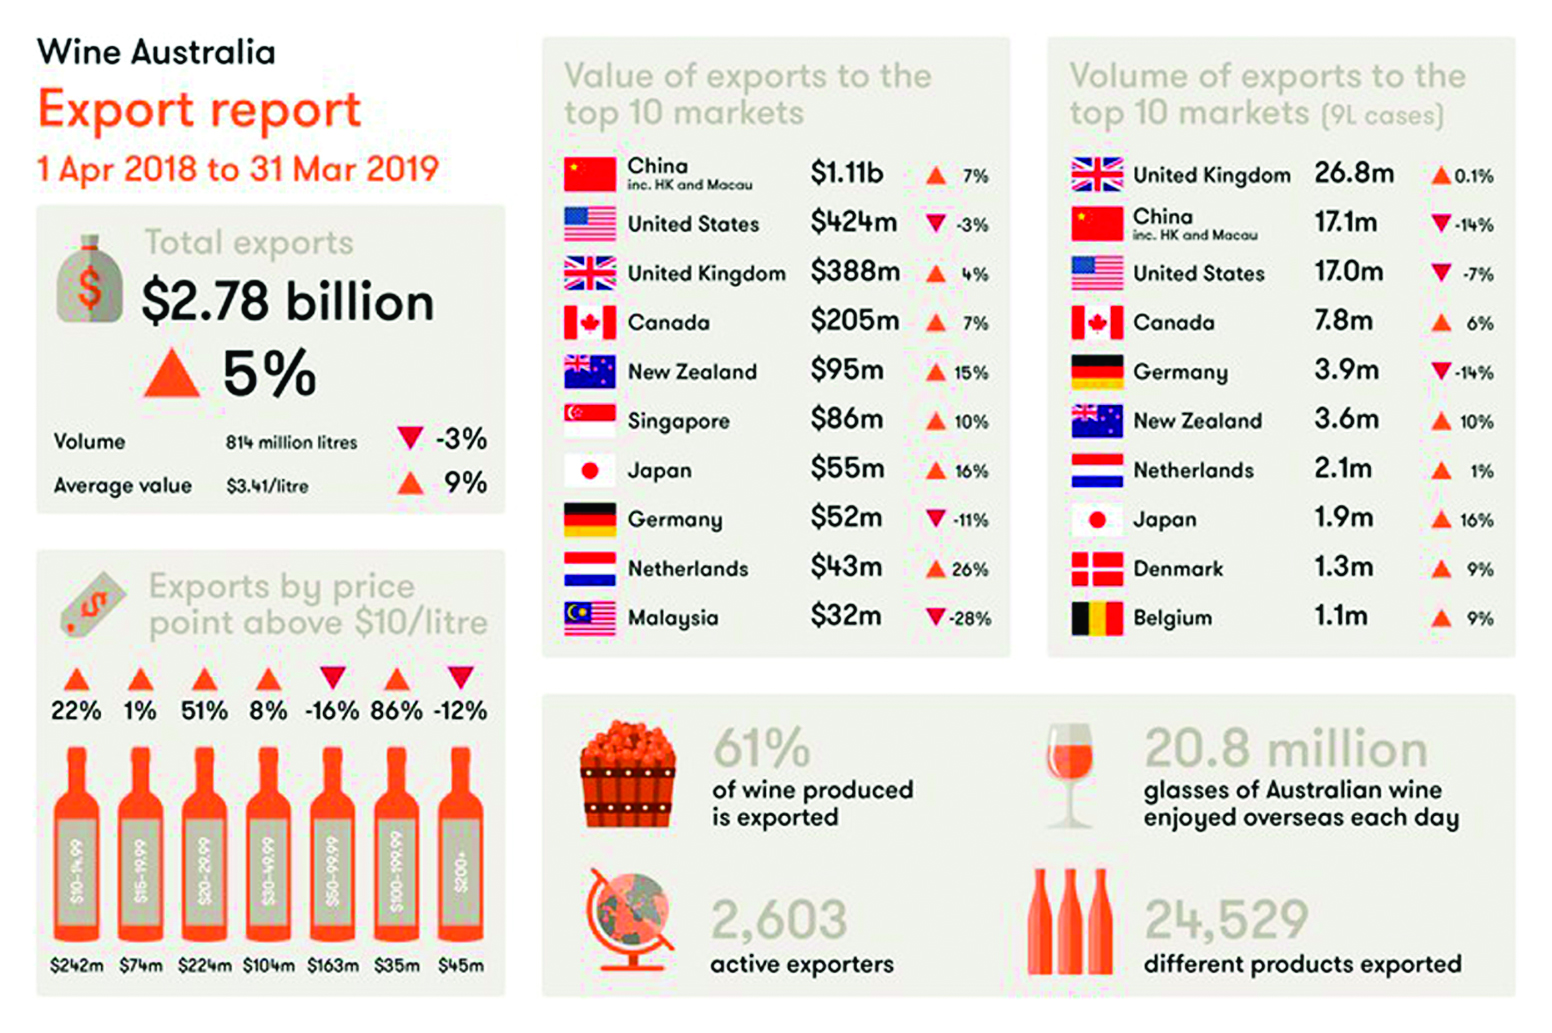
The total value of Australian wine exports increased by 5% to $2.78 billion in the 12 months to March 2019, with the average value per litre climbing to $3.41, the highest level since 2009. Wine Australia Chief Executive Officer Andreas Clark said that the continued growth in the value of exports was an extremely positive trend for the sector.Mr Clark said that while the volume of exports had declined slightly by 3% to 814 million litres (90 million 9-litre case equivalents), the increasing value overall and on average was overwhelmingly positive.
 “What we are seeing is a drop in volumes in the lower value categories and this places Australia well as the global consumer premiumises and drinks less but more expensive wines,” Mr Clark said.
In the China market we have grown our value again and we are outperforming competitors, with the Global Trade Atlas figures showing that in the year ended February 2019, Australia had a 29% share of the imported wine market – up from 26% a year ago
“What we are seeing is a drop in volumes in the lower value categories and this places Australia well as the global consumer premiumises and drinks less but more expensive wines,” Mr Clark said.
In the China market we have grown our value again and we are outperforming competitors, with the Global Trade Atlas figures showing that in the year ended February 2019, Australia had a 29% share of the imported wine market – up from 26% a year ago
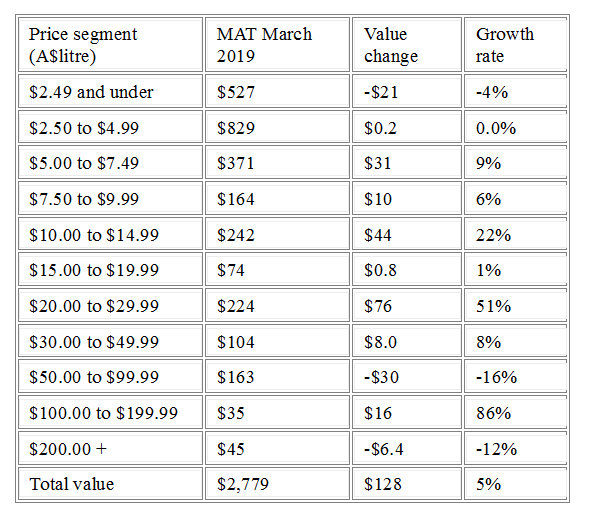
“We are also seeing positive trends in the USA off-trade market where sales of Australian wine grew 3% in value to US$521 million in the year ended December 2018. Even more encouraging is that Australian wine priced above US$15 per bottle has also grown by 3% according to market monitor IRI Worldwide.” Mr Clark said Australian wine supplies would remain tight in the short term with much of the 2018 vintage yet to hit the market and the expectation that 2019 vintage would be below the long-term average. In the year ended March 2019, there was robust growth in most price segments (see Figure 1) with exports in higher priced categories recording the most significant growth, reflecting global premiumisation trends.
 In the 12 months to March 2019, the value of wine exported in glass bottles increased 3% to $2.22 billion and decreased in volume 5% to 355 million litres (39 million 9-litre case equivalents). The combination of the increased value and lower volume means that the average value of bottled wine increased 9% to $6.24 per litre FOB, a near-record.
Other packaging formats include soft pack, which increased 12% in value to $15 million and 9 per cent in volume to 7.7 million litres, and other alternative packaging, which decreased by 2% in value to $6.2 million and 10% in volume to 964 thousand litres. Shipments of unpackaged wine increased in value by 11% to $541 million and decreased in volume by 2% to 450 million litres (50 9-litre case equivalents). The average value of unpackaged wine exports increased by 14% to $1.20 per litre FOB. Nearly all destinations imported more Australian wine in the year ended March 2019 than the previous period. North America is still the exception, with excellent growth in exports to Canada unable to outweigh the decline in exports to the United States of America (USA).
 The regions in growth are:
• Northeast Asia, up 8% to $1.2 billion,
• Europe, up 3% to $612 million,
• Southeast Asia, up 7% to $170 million,
• Oceania, up 15% to $107 million, and the Middle East, up 16% to $32 million.
The regions in growth are:
• Northeast Asia, up 8% to $1.2 billion,
• Europe, up 3% to $612 million,
• Southeast Asia, up 7% to $170 million,
• Oceania, up 15% to $107 million, and the Middle East, up 16% to $32 million.
Australian wine exports to China (including Hong Kong and Macau) increased by 7% in value to $1.11 billion and decreased by 14% in volume to 154 million litres (17 million 9-litre case equivalents) in the year ended March 2019.
The volume decline in the China market is confined almost exclusively to exports in the below $2.50 per litre value segment, reflecting both a tightening of Australian supply in this segment and also the increased supply availability from competitors such as Chile.
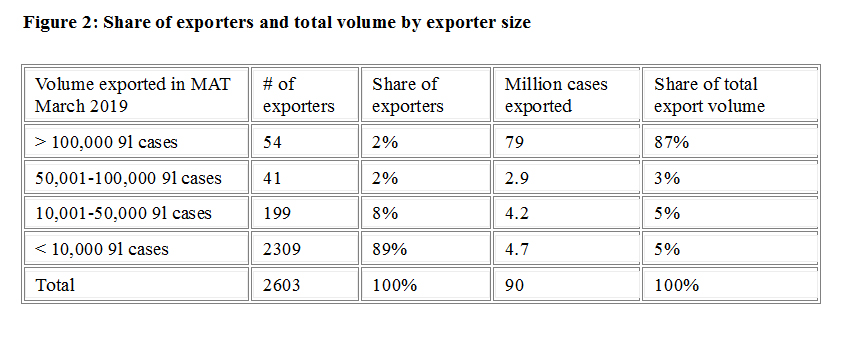 There were 2603 active exporters in the period, a 16% increase from the previous year. During the year, 1786 companies either started exporting or increased the value of their exports, contributing $374 million to the growth in overall value. This growth was partially offset by 1328 exporters whose export value decreased or they ceased shipment altogether; their exports declined by $246 million.
Volume and value growth rates by exporter size illustrate largely positive performances (see Figure 3). While volume decreased by 4% for the largest exporters (those exporting more than 100,000 9-litre case equivalents), all other exporter segments showed healthy growth rates in both volume and value, with the smallest exporters exhibiting the strongest growth.
