
Ramesh Kumar Pandey, Mahipal Singh Sankhla, Rajeev Kumar
Galgotias University, India
Correspondence: Mahipal Singh Sankhla, Research Scholar, Division of Forensic Science, SBAS, Galgotias University, Greater Noida, India
Received: July 31, 2018 | Published: August 31, 2018
Citation: Pandey RK, Sankhla MS, Kumar R. Determination of adulterants in suspected liquor samples using chemical tests. MOJ Toxicol. 2018;4(4):309–314. DOI: 10.15406/mojt.2018.04.00118
Abstract
The term alcohol, used as a proper name, is applied both to the absolute substance farther specified by chemists as ethyl alcohol, and to its mixtures with smaller proportions of water and slight proportions of other substances. In chemistry, the word alcohol is used as a common or generic name to designate several series of substances. Alcohol consumption has existed in India for many centuries. The quantity pattern of used and resultant problems have undergone substantial changes over the past twenty years. This category, created for revenue purposes, consists in western- style distilled beverages such as whisky, rum, gin. These are made in India under government license and the maximum alcohol content allowed is 42.8%. Besides licensed distilleries, a number of small production units operate clandestinely. The raw materials they used are similar to those in country liquor, but since they evade legal quality controls the alcohol concentration in their products varies and adulteration is frequent. It is common to rum, whisky and gin find samples containing up to 56% alcohol. The hazardous adulterant is industrial methylated sprit which irregularly cause mass toxicity of humans who lose their lives or suffer irreversible eye damage. Since no government revenues are paid, illicit liquor is considerably less expensive then license country liquor, and thus finds a ready market among the poor.
Keywords: alcohol, illicit, toxicity, adulteration
Introduction
Describes a simple, fast method of proving identity or brand on the basis of anion composition. This will enable the testing of suspicions that arise during food control. Spirits are reduced to bottling strength with water from rectified distillates. The ionic content of the water and brand-specific water additives used give rise to differences in the ionic composition of the product. The simple, cost-saving, and reliable method of ion chromatography, which is already approved in water analysis, can therefore be used for the determination of anions in spirits. The Selected decreases the organoleptic features of the raw resources. Flavouring may be added to give the product special organoleptic characteristics, such as a mellow taste.1 According to Karnataka Excise Rules (1997), the ethanol content of whisky, rum and gin (IMFL) are mandated at 42.8% volume by volume (75° proof) and of country liquor or arrack at 33.3% volume by volume (65° proof) at 15/15°C. The Karnataka Excise Act specifies that for the manufacture of IMFL and arrack, the basic material is Rectified spirit [manufactured by distillation of molasses] of not less than 166° proof. Such spirit has to be reduced to strengths of 75° proof or 65° proof depending on whether IMFL or arrack is the final product.2 The authenticity of cognacs, whiskies, rums and similar strong alcoholic beverages can be verified by determining the concentrations of ethanol and the following congeners in the product: methanol, higher alcohols and ethyl acetate. These values are then compared with a database of reference samples. Data from quantitative measurement can be processed statistically using principal component analysis (PCA) based on clustering techniques. PCA is a useful method when the data contain large numbers of variables. PCA yields a small body of new variables that incorporate most of the information in the original variables, facilitating the perception of complicated matrices. Such a work-up is presented by with various brands of whiskies being classified into groups by chemical analysis and PCA. Developed a complex, multi-method analysis for brand identification using statistical processing on the basis of chemical composition, ultraviolet absorption, and pH.3 According to Bureau of Indian Standards (1986), the ethanol content of whisky, rum and gin (IMFL) are mandated at 42.8% volume by volume (75° proof) and of country liquor or arrack at 33.3% volume by volume (65° proof) at 15/15°C. The Bureau of Indian Standards specifies that for the manufacture of IMFL and arrack, the basic material is Rectified spirit (manufactured by distillation of molasses) of not less than166 proof. The ingestion of drinks with the nonqualified raw materials containing high levels of adulterants can cause serious health difficulties like metabolic problems, blindness, permanent neurological damage or even death.4 Suggested about traditionally colorless, extract-free spirits (e.g. vodka and white rum) are identified by the detection of volatile substances using gas chromatography (GC).5 The raw spirit put through rectification is usually produced from grain (rye and wheat) and potatoes. In vodka production, the quality of water is of the utmost importance. For premium vodka brands, demineralized water is filtered through activated carbon to absorb unwanted organic and inorganic materials. Then it is passed through deionization columns, which remove other impurities present. The rectified spirit and demineralized water are blended in the correct proportions. The blended spirit is charcoaled for up to 8 h. The charcoal adsorbs impurities that cannot be removed by distillation alone. The vodka is then reduced to its bottling strength by adding further demineralised water.6
Materials and methods
Determination of ethyl alcohol by volume
Two methods have been prescribed in BIS, namely, method I {Hydrometer method (2302-1962)}, method II {Pyknometer method}. In which method I be used as routine method, whereas Method II as referee method.
Procedure: 200ml of sample were taken in a 500ml. distillation flask containing to it about 25ml. of distilled water and a few pieces of pumice stone {a very light porous rock formed from solidified lava, used in solid form as an abrasive and in powdered form as a polish} was added. And the distillation setup is allowed to heat over thermostat, the distillate is collected in a 200ml. measuring flask. The distillate is allowed to cool at the room temperature; the volume was makeup to 200ml. using distilled water and mixed thoroughly. The specific gravity of the distillate at the required temperature was measured with the help of a hydrometer (routine test) and Pyknometer (referee test). The readings were recorded and compared with the standard value as prescribed in the tables of Alcoholometry.4
Determination of suspended solids
Procedure: The contents of the container were mixed thoroughly by shaking it. 250ml. of it were taken and filtered through a dry tared filter paper. The filter paper was dried over the hot air oven at 110o±2oC. After cooling the sample is weighed. And the results were calculated and expressed to four decimal places.
Determination of esters as ethyl acetate
Procedure: To the neutralized distillate from the volatile acidity determination, 10ml. of standard alkali solution was added and refluxed it on a stream bath for an hour. The sample was cooled and back titrated, the excess of alkali with standard sulphuric acid (1ml. of standard alkali is equivalent to 0.0088gm. of acetate). A blank taking 50ml. of distilled in place of the distillate of the sample is run simultaneously in the same way. The difference in titration value in ml. of standard acid solution gives the equivalent ester.4
Determination of higher alcohols
Three methods have been prescribed in BIS, namely, method I (Komarowski method), Method II. Method I may be used to determine approximately the quantity of higher alcohols in process control. Method II shall be employed for accurate determination while method III shall be used as reference method.4
Method I (Komarowski method)
Procedure: A clean glass–stoppered bottle was taken and washed it twice with the spirit to be tested. Similarly, a small cylinder or a 100ml pipette was washed. 10ml. of sprit were taken in the bottle and to it 1ml. of 1% salicylic aldehyde and 20ml. of conc. Sulphuric acid were added. The mixture was allowed to stand at room temperature for over 12hours. The change in colour was noted and compared with the colour developed after the reaction indicates the amount of higher alcohol as follows:
Colour Amount of higher alcohol
- Light yellow only traces
- Yellow to Brown About 0.1% (v/v)
- Brown About 0.2% (v/v)
- Red About 0.5 to 1.0 % (v/v)
- Dark red to Black About 0.5 to 1.0% (v/v)
Method II
Procedure: 50ml. of water was added to the solution resulting from the determination of esters and solution is extracted four times with carbon tetrachloride using 40, 30, 20 and 10ml. respectively. The extracts were washed three times with saturated sodium chloride solution and twice with saturated Sodium Sulphate solution. Carbon tetrachloride was filtered out and to it 50ml. of oxidizing mixture was added and refluxed for two hours. The solution was cooled and the reflux condenser was washed with 50ml. of water and transferred it to the distillation flask using50 ml. of water. Distil till about 50ml. is left over the flask. Avoid charring. The distillate is titrated against standard alkali, using phenolphthalein as indicator (1ml. of standard alkali is equivalent to 0. 0088gm. of amyl alcohol.) Run a blank in the same way taking 100ml. of distilled water in place of the distillate of the liquor.
Determination of ash
Procedure: The contents of the container were shaken and evaporated, 100ml. of the sample is on dried, tared dish over water bath. The dish was placed in a muffle furnace maintained at 450o to 500oC for the about an hour. The dish was Cooled in a desiccator and weighed, the results were expressed to four decimal places.4
Determination of copper
Potassium ferrocyanide method
Procedure: Transfer 20ml. of the material into a silica evaporating dish and add 1ml. of dilute sulphuric acid. Heat gently in the beginning and the evaporate almost to dryness on a water bath. Ignite the residue over a smokeless flame to eliminate sulphuric acid. Cool, dissolve the residue in 2ml. of water, add three drops of aqua regia and evaporate to dryness on the water bath. Dissolve the residue in 2ml. of hydrochloric acid and warm gently the residue is dissolved. Add 0.5gm. of ammonium chloride and dilute with 15ml. of water distill in an all glass apparatus. Add dilute ammonium hydroxide as alkaline. Boil off excess of ammonia and filter into a clean Nessler tube. Cool and then render to the solution acidic with acetic acid (3 to 5 drops are usually sufficient). Dilute to 40ml. Add 0.5ml. of potassium ferrocyanide solution, stir and make up the volume to 50ml. {Note: – If the copper is more, a lesser amount of the material may be taken for the test.} Prepare a series of control solutions each containing in 50ml. 0.5gm. of ammonium chloride, 3 to 5 drops of acetic acid and 0.5ml. potassium ferrocyanide solution together with an increase amount of copper, namely 2, 4, 6, 8, and 10ml. of the standard copper solution Compare the test solution with control solutions and note the number of ml. of standard copper solution added in the control solution having, as nearly as possible, the same intensity of color as that of the test solution.4
Result and discussion
These research work was carried out at the India Brewery and Distillery Ltd, Bidar, Karnataka, India. Check the specification of liquors. In the study Qualitative analysis for the presences of illicit content like Copper, Ash, Ethyl Alcohol, Higher Alcohol Content, Acetaldehyde and Fixed Acidity present in the liquor sample were done by using the presumptive colour tests and the results are reported. Content in the samples were analyzed qualitatively and quantitatively for determination of the strength of the liquor sample and results are reported in tables and figures. The quantitative determination of the contents liquors were examined by the prescribed methods of the BIS (3752-1956) guidelines to check their quantity in the suspected liquors as in illicit liquor there me be increased quantity of these contents shown table 1-12 and figure 1-12. These results reported here shows that the suspected liquor shows the presence of illicit components like Copper, Ash, Ethyl Alcohol, Higher Alcohol Content, Acetaldehyde and Fixed Acidity. The quantitative analysis of the suspected and standard samples showed that the contents of standard liquors are within permissible limit of the BIS however the suspected liquor samples showed the exceed limit of these contents.
Estimation of ethyl alcohol (v/v)
The Table 1 and Figure 1 shows the Ethyl alcohol percentage in standard Liquor sample as reported in Whisky, Rum and Gin were found to be under the permissible limits described by BIS. However Table 2 and Figure 2, shows the exceed limit of ethyl alcohol content in the suspected samples of Whisky, Rum and Gin.
| Brands | Sample 1 | Sample 2 | Sample 3 |
| Whisky | 42.6 % v/v | 42.7% v/v | 42.6% v/v |
| Rum | 42.9% v/v | 42.7% v/v | 42.7% v/v |
| Gin | 42.4% v/v | 42.6% v/v | 42.6% v/v |
Table 1 Estimation of Ethyl alcohol (%) in standard Whisky, Rum and Gin sample
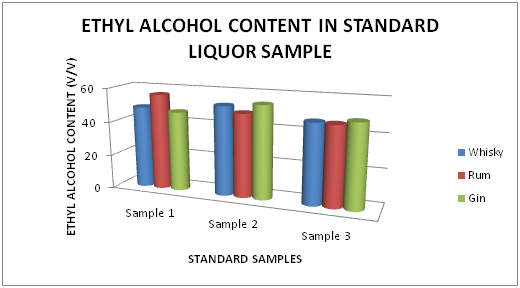
Figure 1 Estimation of Ethyl alcohol (%) in standard Whisky, Rum and Gin sample.
| Brands | Sample 1 | Sample 2 | Sample 3 |
| Whisky | 48.4% v/v | 36.5% v/v | 34.4% v/v |
| Rum | 56.4% v/v | 48.8% v/v | 46.4% v/v |
| Gin | 46.8% v/v | 54.4% v/v | 48.6% v/v |
Table 2 Estimation of Ethyl alcohol (%) in suspected Whisky, Rum and Gin sample
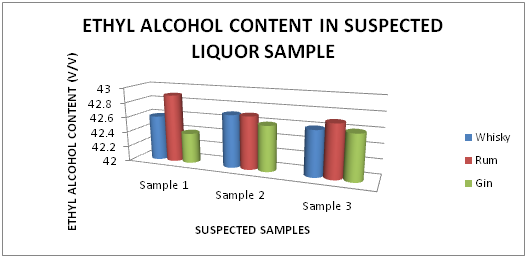
Figure 2 Estimation of Ethyl alcohol (%) in suspected Whisky, Rum and Gin sample.
Estimation of ash (%)
The Table 3 and Figure 3, showing the Ash percentage in standard Liquor sample as reported in Whisky, Rum and Gin were found to be under the permissible limits described by BIS. However, Table 4 and Figure 4, shows the exceed limit of Ash percentage in the suspected samples of Whisky, Rum and Gin.
| Brands | Sample 1 | Sample 2 | Sample 3 |
| Whisky | 0.01 | 0.018 | 0.017 |
| Rum | 0.018 | 0.016 | 0.018 |
| Gin | 0.019 | 0.018 | 0.015 |
Table 3 Estimation of Ash (%) in Standard Whisky, Rum and Gin samples
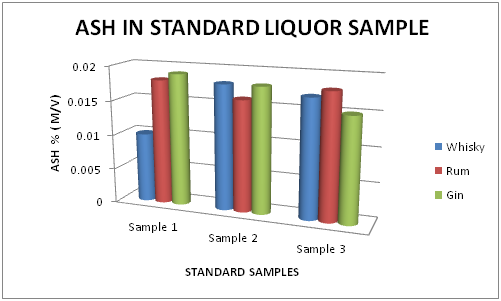
Figure 3 Estimation of Ash (%) in standard Whisky, Rum and Gin samples.
| Brands | Sample 1 | Sample 2 | Sample 3 |
| Whisky | 0.10 | 0.10 | 0.15 |
| Rum | 0.15 | 0.15 | 0.20 |
| Gin | 0.9 | 0.6 | 0.6 |
Table 4 Estimation of Ash (%) in Suspected Whisky, Rum and Gin samples
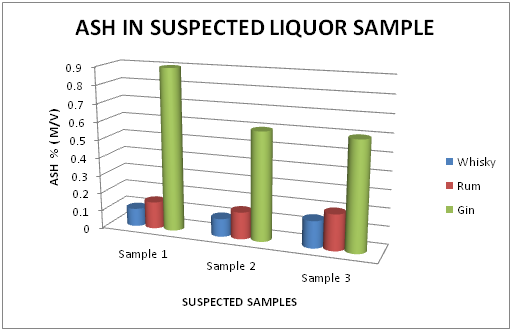
Figure 4 Estimation of Ash (%) in suspected Whisky, Rum and Gin samples.
Estimation of higher alcohol content
The Table 5 and Figure 5 showing the Higher Alcohol present in standard Liquor sample as reported in Whisky, Rum and Gin were found to be under the permissible limits described by BIS. However, Table 6 and Figure 6, shows the exceed limit of Higher Alcohol in the suspected samples of Whisky, Rum and Gin.
| Brands | Sample 1 | Sample 2 | Sample 3 |
| Whisky | 2.00 | 2.50 | 2.00 |
| Rum | 1.50 | 2.00 | 1.50 |
| Gin | 4.20 | 4.00 | 4.20 |
Table 5 Estimation of Higher Alcohol in Standard Whisky, Rum and Gin samples
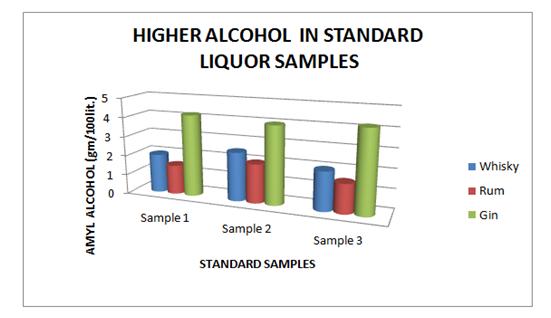
Figure 5 Estimation of higher alcohol in Standard Whisky, Rum and Gin samples.
| Brands | Sample 1 | Sample 2 | Sample 3 |
| Whisky | 3.50 | 3.80 | 3.80 |
| Rum | 3.80 | 3.60 | 3.80 |
| Gin | 5.00 | 4.80 | 4.80 |
Table 6 Estimation of Higher Alcohol in Suspected Whisky, Rum and Gin samples
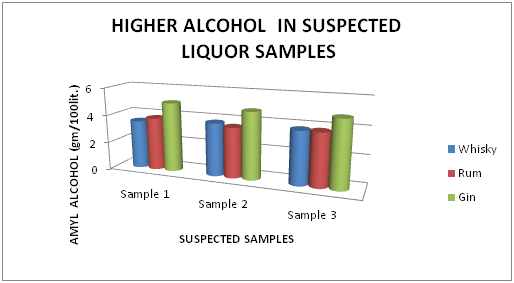
Figure 6 Estimation of higher alcohol in Suspected Whisky, Rum and Gin samples.
Estimation of acetaldehyde
The Table 7 and Figure 7, showing the Acetaldehyde present in standard Liquor sample as reported in Whisky, Rum and Gin were found to be under the permissible limits described by BIS. However, Table 8 and Figure 8, shows the exceed limit of Acetaldehyde in the suspected samples of Whisky, Rum and Gin.
| Brands | Sample 1 | Sample 2 | Sample 3 |
| Whisky | 4.2 | 4.4 | 4.2 |
| Rum | 4.18 | 4.16 | 4.18 |
| Gin | 0.18 | 0.16 | 0.18 |
Table 7 Estimation of Acetaldehyde in Standard Whisky, Rum and Gin samples
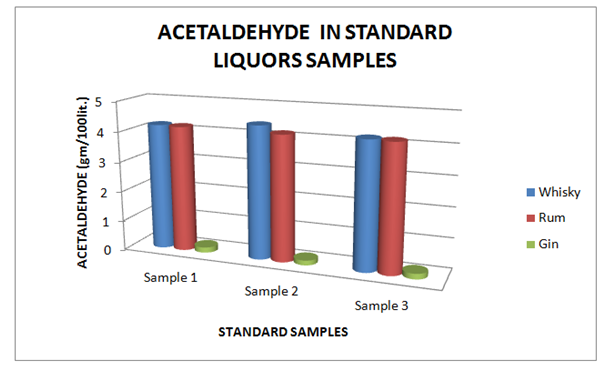
Figure 7 Estimation of Acetaldehyde in Standard Whisky, Rum and Gin samples.
| Brands | Sample 1 | Sample 2 | Sample 3 |
| Whisky | 4.80 | 4.60 | 4.60 |
| Rum | 5.0 | 5.20 | 5.10 |
| Gin | 0.40 | 0.60 | 0.40 |
Table 8 Estimation of Acetaldehyde in Suspected Whisky, Rum and Gin samples
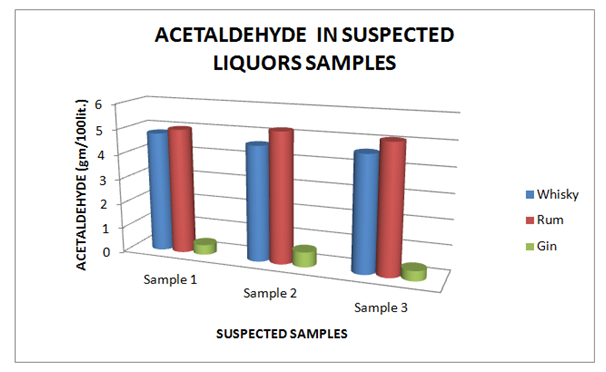
Figure 8 Estimation of Acetaldehyde in Suspected Whisky, Rum and Gin samples.
Estimation of copper
The Table 9 and Figure 9, showing the Copper present in standard Liquor sample as reported in Whisky, Rum and Gin were found to be under the permissible limits described by BIS. However, Table 10 and Figure 10, shows the exceed limit of Copper in the suspected samples of Whisky, Rum and Gin. The Table 11 and Figure 11, showing the Ethyl Acetate present in standard Liquor sample as reported in Whisky, Rum and Gin were found to be under the permissible limits described by BIS. However, Table 12 and Figure 12, shows the exceed limit of Ethyl Acetate in the suspected samples of Whisky, Rum and Gin.
| Brands | Sample 1 | Sample 2 | Sample 3 |
| Whisky | 0.008 | 0.009 | 0.008 |
| Rum | 0.009 | 0.008 | 0.009 |
| Gin | 0.008 | 0.009 | 0.008 |
Table 9 Estimation of Copper in Standard Whisky, Rum and Gin samples
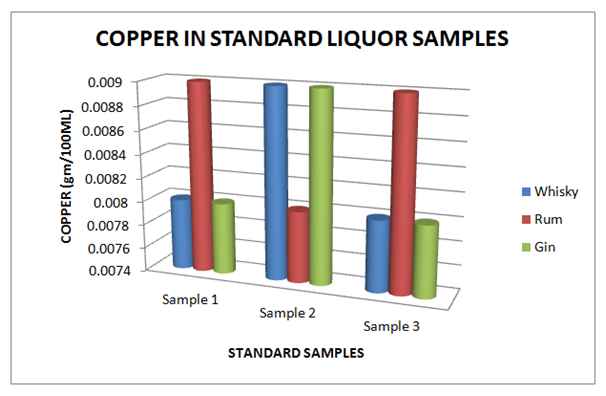
Figure 9 Estimation of Copper in standard Whisky, Rum and Gin samples.
| Brands | Sample 1 | Sample 2 | Sample 3 |
| Whisky | 0.018 | 0.010 | 0.015 |
| Rum | 0.010 | 0.005 | 0.015 |
| Gin | 0.016 | 0.015 | 0.015 |
Table 10 Estimation of Copper in Suspected Whisky, Rum and Gin samples
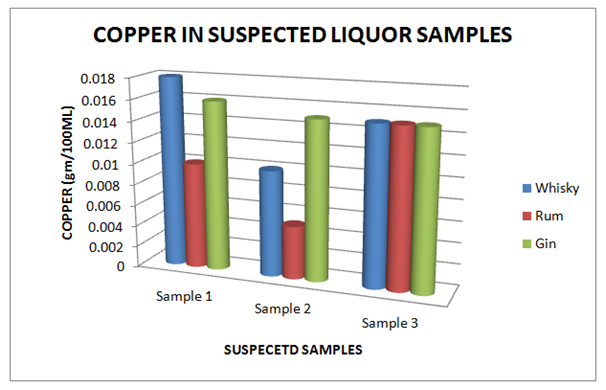
Figure 10 Estimation of Copper in Suspected Whisky, Rum and Gin samples.
| Brands | Sample 1 | Sample 2 | Sample 3 |
| Whisky | 0.24 | 0.28 | 0.28 |
| Rum | 0.18 | 0.20 | 0.18 |
| Gin | 0.58 | 0.60 | 0.58 |
Table 11 Estimation of Ethyl Acetate in Standard Whisky, Rum and Gin samples
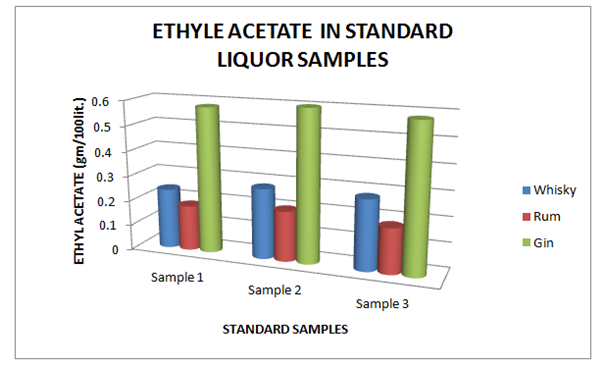
Figure 11 Estimation of Ethyl Acetate in Standard Whisky, Rum and Gin samples.
| Brands | Sample 1 | Sample 2 | Sample 3 |
| Whisky | 0.40 | 0.60 | 0.40 |
| Rum | 0.20 | 0.15 | 0.20 |
| Gin | 0.80 | 0.60 | 0.60 |
Table 12 Estimation of Ethyl Acetate in Suspected Whisky, Rum and Gin samples
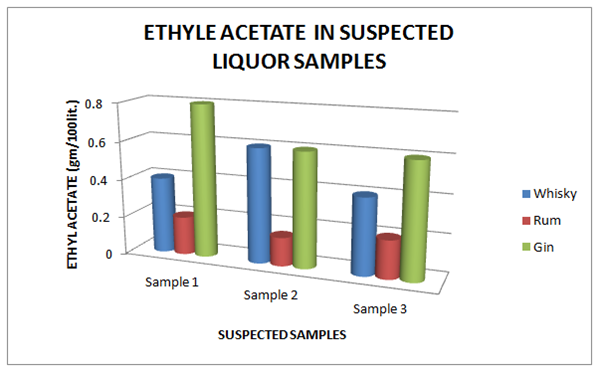
Figure 12 Estimation of Fixed Acidity in Standard Whisky, Rum and Gin samples.
Conclusion
These research work present the suspected sample of liquor are the various type of contamination and the results are shown that the liquor are not drinking purpose. The adulterants contaminations is a major problem in India. The partial data available around prices, it appears that there is ground for the probability that at minimum some home or locally made beverages are cheaper than mass or factory produced “branded” beverages. In some cases the price difference is quite significant. This means that it is mostly the poorer segments of the society which consume these local beverages, except in the case of some culturally important beverages which might have ceremonial value.
Acknowledgements
None.
Conflict of interest
Author declares that there is none of the conflicts.
References
- European Council. Off J Eur Comm L. 1989;160:1–17.
- Karnataka Excise Rules (Regulation of Yield, Production and Wastage of Spirit, Beer, Wine or Liquors) (1997).
- Lehtonen PJ, Keller LA, Ali-Mattila ET. Z Lebeansm Unters Forsch A. 1999;208:413–417.
- Bureau of Indian Standards, Indian standard manual for alcoholic drinks and methods of test, 1986.
- Frank W. Qualittssicherung, Organisation und Analy-senmethoden. In: Kolb E editor. Spirituosen Technologie. Behr’s Verlag, Germany: Hamburg; 2002. p. 425–472.
- http://www.smirnoff.com
©2018 Pandey, et al. This is an open access article distributed under the terms of the, which permits unrestricted use, distribution, and build upon your work non-commercially.


 display math
where E0 is the equilibrium potential. By comparing Cu/CNS to control electrodes comprised of 1) Cu on glassy carbon and 2) bare CNS, we demonstrate that CO2 reduction activity is not a simple consequence of either Cu or CNS. While the reaction mechanism is not yet elucidated, we hypothesize an interaction between adjacent catalytic sites on the Cu and CNS, facilitated by the nanostructured morphology of the catalyst that prevents complete electrochemical reduction to ethylene or ethane, resulting in a high yield of ethanol.
Results and discussion
The bare CNS electrode (Supporting Information Figure?S1) was characterized in our previous study as a dense nanotextured carbon film terminated by randomly oriented nanospikes approximately 50–80?nm in length, where each nanospike consists of layers of puckered carbon ending in a ?2?nm wide curled tip.[15] The film is grown by a relatively simple direct-current plasma-enhanced chemical vapor deposition reaction using acetylene and ammonia as reagents.
The CNS film grows quickly and adheres well to the highly-doped silicon wafers that were used for this study. Raman spectra indicate that CNS have a similar structure to disordered, few-layer graphene.[15] The CNS is not crystalline and does not diffract. XPS indicates a nitrogen doping density of 5.1 ± 0.2?% atomic, with proportions of pyridinic, pyrrolic (or piperidinic) and graphitic nitrogens of 26, 25 and 37?% respectively, with the balance being oxidized N. In the current experiment, nanoparticles of Cu were electronucleated from CuSO4 solution directly onto the CNS (Supporting Information, Experimental Methods), and imaged via SEM shown in Figure?1. Electronucleation does not require templating surfactants to control the nanoparticle growth, and leaves the particle surfaces clean. The texture of the CNS promotes nucleation resulting in a large number of smaller particles, in comparison to the glassy carbon control which produced larger particles under identical conditions (Supporting Information Figure?S2), with a similar amount of Cu deposited. These well-dispersed Cu particles ranged from about 30?nm to 100?nm with average size of 39.18?nm, with a density ca. 2.21 × 10⁹ particles cm?2 (Figure?1B inset). According to the average particle size, the coverage of Cu on CNS is ca. 14.2?%. TEM measurements (Figure?2 inset) confirm particle size observed via SEM. High-resolution transmission electron microscopy on scraped samples (HR-TEM) shows the Cu/CNS interface (Figure?2 main) and illustrate a close proximity between Cu and CNS. The lattice spacing of this representative Cu nanoparticle was measured as 0.204?nm, which is consistent with Cu (111). Cu2O with lattice spacing ca. 0.235?nm were present on the Cu nanoparticles surface in this image, however due to the negative potential applied for Cu deposition, the oxide likely results from exposure to air during sample preparation and transportation between measurements.[16] The surface area of the textured surface of CNS and the glassy carbon was measured based on the double layer capacitance on both electrodes in 0.1?M KOH. Capacitance was measured by recording anodic-cathodic charging currents (in the potential region where Faradaic processes are absent; see Supporting Information Figure?S3). The active surface area of CuNPs was additionally measured by Pb underpotential deposition (Supporting Information) of a representative sample, but could not be measured for each sample without contamination. The Cu nanoparticles typically contribute approximately 8?% to the total electrode ECSA for the CNS. To measure the physical stability of the catalyst, SEM images were collected of the particles and the CNS cross sections before and after a 6-hour reduction experiment (Supporting Information Figures S4, S5).
Figure 1.
Figure 1. Open in figure viewerDownload Powerpoint slide
Representative SEM images of Cu/CNS electrode with (A) low and (B) high magnification. The average particle size is approximately 39?nm (C) as measured by automated particle sizing of the micrographs..
Figure 2.
Figure 2. Open in figure viewerDownload Powerpoint slide
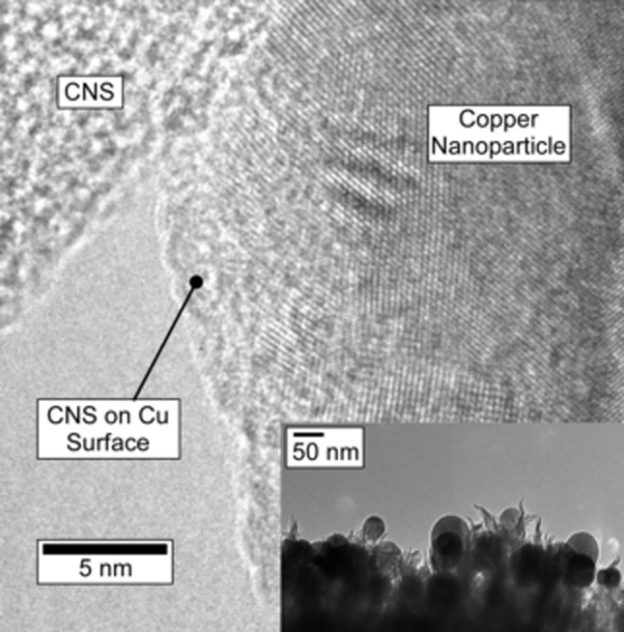
HR-TEM of electrodeposited copper nanoparticles on carbon nanospike electrode. Electrodeposited particles are imbedded in N-doped carbon nanospikes providing intimate contact between copper surface and reactive sites in the carbon.
CO2 electroreduction activity was first measured by linear sweep voltammetry (LSV) in the potential range of ?0.00 to ?1.30?V vs. RHE at a sweep rate of 0.05?V s?1 as shown in Figure?3. In the presence of CO2-saturated potassium bicarbonate electrolyte, using the Cu/CNS, significant anodic shifts in the onset potential are observed compared to that under an argon atmosphere; the onset of activity in CO2 saturated electrolyte is ? 0.3?V more positive than in argon purged electrolyte. Note that unlike the featureless voltammograms obtained under an argon atmosphere, a subtle current plateau is obtained at ? ?0.9?V on electrodes with Cu nanoparticle in CO2 saturated electrolyte. But in the case of pristine CNS electrode, no activity towards CO2 reduction is observed except the onset of hydrogen evolution at much more negative potential. Larger current densities were obtained in Cu/CNS than either of the controls.
Figure 3.
Figure 3. Open in figure viewerDownload Powerpoint slide
LSV curves in potential range of 0.00 to ?1.30?V vs. RHE at a sweep rate of 0.05?V s?1 in 0.1?M KHCO3 under (A) argon and (B) CO2 atmosphere on pristine CNS (black), Cu/glassy carbon (red) and Cu/CNS (blue) electrodes. The current density is calculated using the electrochemical surface area (ECSA) of the electrode based on the double layer capacitance on CNS and glassy carbon electrodes in 0.1?M KOH, respectively..
Chronoamperometry (CA) measurements were conducted over a potential range from ?0.7 to ?1.3?V, which included these two reduction waves (representative data in Figure?4B for Cu/CNS and Supporting Information Figure S6?A for bare CNS and Cu/glassy carbon controls). New electrodes were fabricated for each data point. The gaseous and liquid products of each CA run were analyzed by gas chromatography (GC) and NMR (of headspace and electrolyte, respectively) to calculate overall current density and Faradaic efficiency for CO2 reduction and for each product. The overall sustained current density for CO2 reduction, JCO2 redn, increased with more negative potential (Supporting Information Figure?S6B) for all three electrodes, consistent with that shown in LSV curves. The Cu/CNS electrode had a greater propensity for CO2 reduction than either the Cu/glassy carbon or bare CNS electrodes; for instance, JCO2 redn from Cu/CNS was 5-fold higher than for bare CNS and 3-fold higher than for Cu/glassy carbon, at ?1.2?V.
Figure 4.
Figure 4. Open in figure viewerDownload Powerpoint slide
Fractional Faradaic efficiency of electrochemical reduction products at various potentials (A). The distribution of products indicates that up to ?0.9?V, only gas phase products are produced. At more negative potentials, the rate of CO production on the copper surface is high enough to allow CO dimerization to occur, producing C2 products and subsequently ethanol. Chronoamperometry on Cu/CNS at ?1.2?V (B) indicates that the electrode is stable although the distribution of products does change with time, beginning with a higher rate of H2 production which drops after the first 5000 seconds. Additional information including relative errors is available in Supporting Information Figure?S7.
The fractional Faradaic efficiency was computed by dividing the total electrons into each product (determined independently by chemical analysis) by the total electrons passed during the amperometry experiment. The fractional Faradaic efficiencies for Cu/CNS plus the controls at a range of potentials are shown in Figure?4?A, and for Cu/CNS at ?1.2?V over a 6-hour experiment in Figure?4B (Additional data including relative error for Cu/CNS are available in Supporting Information Figure?S7). Due to experimental losses between the anode and cathode, the total fractions are less than 100?%. The Cu/CNS electrode appears to be stable, as the current density and fractional Faradaic efficiencies for each product barely decreased over the 6?h experiment (Figure?4?A). No significant changes in the Cu nanoparticle size and or CNS thickness was observed from SEM (Figures S4, S5), indicating that the Cu/CNS is stable under these experimental conditions.
At ?0.9?V vs. RHE and more positive potential, only gas phase products H2, CO and CH4 were obtained from all three electrodes with CH4 as the major product Cu/CNS. In contrast, with bare CNS and Cu/glassy carbon, CO was the major product and the CO / CH4 ratio was almost independent of potential. The higher selectivity towards CH4 in Cu/CNS indicates a higher degree of surface-bound CO hydrogenation, which is a key step in the formation of CH4.[17] At ?1.0?V vs. RHE and more negative potential, the current density of CO2 reduction increased and ethanol was produced (as a liquid soluble in the aqueous electrolyte) only from Cu/CNS. In comparison, only CO and CH4 were produced from both control electrodes. At-1.3?V vs. RHE the Cu/glassy carbon also produced trace ethylene (representative GC traces, Supporting Information Figure?S8). GC and NMR analysis in search of other products more commonly produced by copper electroreduction, such as methanol or ethane only indicated (representative NMR, Supporting Information Figure?S9) occasional trace formate from Cu/CNS.
Examining the breakdown of Faradaic efficiencies for various reactions on Cu/CNS, reveals that at ?1.2?V (Figure?4?A), ethanol conversion exhibited the highest efficiency at 63?% (that is, 63?% of the electrons passing through the electrode were stored as ethanol). Also at ?1.2?V vs. RHE, the Faradaic efficiency of gas phase products methane and CO dropped to 6.8?% and 5.2?%, respectively. The Faradaic efficiency of CO2 reduction (competing against water reduction) is 75?%. This means that under the best conditions, the overall selectivity of the reduction mechanism for conversion of CO2 to ethanol is 84?%.
The partial current density and Faradaic efficiency of each product from Cu/CNS electrode at various potentials were illustrated in Figure?5. The partial current density and Faradaic efficiency for CO and methane exhibited a volcanic shape dependence to the potentials applied. The maximum total current density and Faradaic efficiency were observed at ?1.0?V vs. RHE, and decreased when ethanol generation began. The partial current density for ethanol generation increased dramatically with more negative potential until reaching ?1.2?V vs. RHE, where the maximum Faradaic efficiency for ethanol generation was also achieved. Above ?1.2?V vs. RHE, the rate of increase for ethanol current density was slower, consistent with CO2 mass transport limitations. Data were not collected above ?1.3?V vs. RHE because hydrogen bubbles that evolved from water reduction blocked the electrode. The decline of Faradaic efficiency for ethanol above ?1.2?V vs. RHE suggests that the catalyst reached the mass-transport-limited current density for CO2 reduction, and therefore hydrogen evolved via H2O reduction at unoccupied active sites.
Figure 5.
Figure 5. Open in figure viewerDownload Powerpoint slide
Partial current density (J, red) and Faradaic efficiency (FE, blue) of CO2 reduction products from Cu/CNS electrode at various potentials.
Previous reports of CO2 electroreduction on copper have demonstrated a variety of C1 and C2 products, including CO, CH4, CH2O2, ethane, ethylene, ethanol. Heavier hydrocarbons have not been reported as majority products.[9] Concerning the reaction mechanism, initial electron transfer to adsorbed CO2 will form CO2•?ads, which can be further reduced to COads or other C1 intermediates (CHOads or CH2Oads) with additional proton-electron transfer. CO will result from desorption of COads at this stage, or alternatively, further electron transfer to these surface-adsorbed species will lead to CH4.[1b, 13b] CO2 reduction results on the two controls, bare CNS and Cu nanoparticles on glassy carbon, indicate that both Cu metal and CNS are active for electrochemical CO2 reduction. On the Cu surface, stronger adsorption of CO exists than bare CNS, which provides stable intermediates for further reduction to CH4 on Cu/glassy carbon. In contrast, CO was released rather than reduced to CH4 on bare CNS.
Tafel plots (overpotential vs. the log of partial current density) for CO and CH4 are shown in Figure?6. For all three samples the plots are linear at low overpotential range with a slope that is consistent with a rate-determining initial electron transfer to CO2 to form a surface adsorbed CO2•? intermediate (120 mV / dec), a mechanism that is commonly invoked for metal electrocatalysts.[8b] At high overpotential range, steep slopes were obtained, probably indicating control by the combined effects of gas diffusion and ionic mass transport.[18] Comparing Cu/CNS to the control electrodes, a direct and intimate contact was introduced between Cu and CNS (Figure?2). Lim et?al. predicted a strong interaction between Cu nanoparticles and carbon, and we expect that to extend to CNS as well.[12] We expect that the strong interaction provides an environment in which a mechanism involving reactive sites on both the Cu surface and on the N-doped CNS may dominate.
Figure 6.
Figure 6. Open in figure viewerDownload Powerpoint slide
(A) CO and (B) CH4 partial current density Tafel plots.
The Cu/CNS catalyst is unusual because it primarily produces ethanol rather than methane or ethylene. Ethanol, as a C2 product, requires carbon-carbon coupling between surface-adsorbed intermediates at some point during the reduction reaction. Recent calculations on C?C coupling on Cu(211) surfaces suggest the kinetic barriers for the coupling are strongly influenced by the degree of the adsorbed CO hydrogenation.[19] These kinetic barriers tend to decrease with increasing degree of the surface bound CO hydrogenation, which can favor the C2 products from CO2 reduction.[20] A high percentage of C2 products would indicate that coupling is preferred to desorption and loss of C1 intermediates, and this preference for adsorption may be due to the nanostructured nature of the surface. Although initial CO2 reduction appears to be the rate-limiting step, the resulting intermediate must be stable enough to persist until a second intermediate is available for C2 coupling. The coupling may be between two surface-bound C1 intermediates, or between a surface-bound C1 intermediate and a nearby C1 intermediate in solution.[17, 21]
The maximum Faradaic efficiency of ethanol for Cu/CNS is reached at ?1.2?V vs. RHE. Further increase in overpotential (?1.3?V vs. RHE) increases Jethanol, but results in a lower Faradaic efficiency due to an increase in H2 production. Hence the proton and electron transfers to C1 become more favorable to produce CH4, which provides a competing pathway against C2 coupling. The details of the reaction mechanism are still to be determined at this time, however there are some lessons in the literature that may yield insights into the high selectivity of this catalyst. Ordinarily, on bulk copper the coupled C2 would continue to be reduced to ethylene or ethane so long as the product was in contact with the copper electrode.[8a, 22] In contrast, with this experiment we have not been able to detect any C2 product except ethanol using the Cu/CNS (ethylene was detected in the control sample Cu/glassy carbon), indicating that the dominant reaction mechanism precludes competitive reduction to ethylene or ethane. Kondo, et al. reported that the electronic structure near the Fermi level of graphene is modified in N-doped graphene, where localized ? electronic states are reported to form at the neighboring carbon atoms, and propagate anisotropically around the defect due to the perturbation of the ?-conjugated system.[23] Due to electron-withdrawing effects in the graphene ?-conjugated system, the carbon atoms adjacent to nitrogen are positively polarized. This polarization may provide an active site adjacent to the copper for the C2 intermediates to adsorb, which may inhibit complete electroreduction.[24] Other doped or defected graphenes are well known to be catalytically active for reactions such as dehydrogenation.[25]
First-principles density functional theory (DFT) calculations were carried out to investigate whether the nitrogen dopant or strongly curled morphology in the CNS can help to adsorb the C2 intermediates. As CNS has a similar structure to multilayer graphene, a graphene sheet is adopted to model the interaction between CNS and the C2 intermediates. The dimer of CO, OCCO, was chosen as a C2 intermediate candidate[19] for modeling of the interaction with CNS. For a pristine graphene sheet, our calculations suggest the binding energy between OCCO (through one oxygen atom) and graphene is 0.19?eV with a separation distance ?2.95?Å (Supporting Information Figure?S10?A). For N-doped graphene, the N dopant and adjacent carbon atoms become more active so that the binding energy with OCCO is increased to 0.64?eV with the separation distance shortened to ?2.70?Å (Supporting Information Figure?S10B). The tripling of the binding energy to 0.64?eV clearly indicates that the C2 intermediates, once formed, can be adsorbed by N-doped CNS fairly strongly and may not desorb easily at room temperature. Furthermore, it is important to note that CNS are puckered and curled, indicating local corrugation on the surface. It has been shown previously that local deformation or buckling could enhance the molecular adsorption on carbon nanotubes and graphene.[26] Here we also considered the buckling of pristine and N-doped graphene to investigate the local curvature effect on OCCO adsorption. Upon buckling, the binding energy between OCCO and the concave surface of pristine graphene is increased to 0.34?eV (Supporting Information Figure?S10C), while the binding energy between OCCO and the concave surface of N-doped graphene is enhanced to 0.74?eV (Supporting Information Figure?S10D). Therefore, the corrugation and curvature naturally embedded into CNS could also help to strengthen the binding between CNS and the C2 intermediates. In addition, we studied the interaction between OCCO and the copper surface, and found that a strong covalent binding is present (when the molecule approaches the Cu surface oriented with one end closer to the surface) with the separation distance reduced to ?1.98?Å and binding energy increased to ?1.21?eV (Supporting Information Figure?S11). Compared to this relatively strong covalent bond, the binding between OCCO and CNS is weaker, though strong enough to prevent easy desorption of the C2 intermediate. The calculations offer important insights into the observed selective reduction, and we expect that the oxygen atom on one end of the C2 intermediates is covalently bound on reactive copper surface for complete reduction to -CH3, while the oxygen atom on the other end of the C2 intermediates is adsorbed on less reactive CNS and thus protected from complete reduction (hence forming -CH2OH), thereby providing a pathway towards selective reduction to ethanol. The possibility that a synergistic effect between Cu and CNS is responsible for the selectivity is surprising given the large size of the Cu nanoparticles, however there is no doubt that the Cu is necessary for this reaction as bare CNS do not produce the same products. Likewise, Cu nanoparticles nucleated on glassy carbon (or any other copper reported to date) do not produce the same products without CNS. While the Cu particles are relatively large, they are on the scale of the CNS which are around 50?nm in length and tend to be imbedded within the spikes. A more detailed understanding of the reaction pathway of such selective reduction of CO2 to ethanol warrants further study.
Conclusion
We report an electrocatalyst which operates at room temperature and in water for the electroreduction of dissolved CO2 with high selectivity for ethanol. The overpotential (which might be lowered with the proper electrolyte, and by separating the hydrogen production to another catalyst) probably precludes economic viability for this catalyst, but the high selectivity for a 12-electron reaction suggests that nanostructured surfaces with multiple reactive sites in close proximity can yield novel reaction mechanisms. This suggests that the synergistic effect from interactions between Cu and CNS presents a novel strategy for designing highly selective electrocatalysts. While the entire reaction mechanism has not yet been elucidated, further details would be revealed from conversion of potential intermediates (e.?g. CO, formic acid and acetaldehyde) in future work.
Acknowledgements
This research was conducted at the Center for Nanophase Materials Sciences, which is a Department of Energy (DOE) Office of Science User Facility.
Ancillary
Supporting Information
1
1a
Y. Hori, K. Kikuchi, A. Murata, S. Suzuki, Chem. Lett. 1986, 15, 897–898;
CrossRef | Web of Science® Times Cited: 199
1b
Y. Hori, A. Murata, R. Takahashi, J. Chem. Soc., Faraday Trans. 1 1989, 85, 2309–2326;
CrossRef | CAS | Web of Science® Times Cited: 318
1c
D. W. DeWulf, T. Jin, A. J. Bard, J. Electrochem. Soc. 1989, 136, 1686–1691.
CrossRef | CAS | Web of Science® Times Cited: 129
2
2a
Y. Tomita, S. Teruya, O. Koga, Y. Hori, J. Electrochem. Soc. 2000, 147, 4164–4167;
CrossRef | CAS | Web of Science® Times Cited: 43
2b
M. Z. Ertem, S. J. Konezny, C. M. Araujo, V. S. Batista, J. Phys. Chem. Lett. 2013, 4, 745–748;
CrossRef | PubMed | CAS | Web of Science® Times Cited: 56
2c
R. Kortlever, I. Peters, S. Koper, M. T. Koper, ACS Catal. 2015.
3
3a
C. Costentin, S. Drouet, M. Robert, J.-M. Savéant, Science 2012, 338, 90–94;
CrossRef | PubMed | CAS | Web of Science® Times Cited: 166 | ADS
3b
C. Costentin, G. Passard, M. Robert, J.-M. Savéant, J. Am. Chem. Soc. 2014, 136, 11821–11829.
CrossRef | PubMed | CAS | Web of Science® Times Cited: 31
4
Y. Wang, J. Zhou, W. X. Lv, H. L. Fang, W. Wang, Appl. Surf. Sci. 2016, 362, 394–398.
CrossRef | CAS | Web of Science® | ADS
5
5a
C. E. Tornow, M. R. Thorson, S. Ma, A. A. Gewirth, P. J. Kenis, J. Am. Chem. Soc. 2012, 134, 19520–19523;
CrossRef | PubMed | CAS | Web of Science® Times Cited: 47
5b
J. Rosen, G. S. Hutchings, Q. Lu, S. Rivera, Y. Zhou, D. G. Vlachos, F. Jiao, ACS Catal. 2015, 5, 4293–4299;
CrossRef | CAS | Web of Science® Times Cited: 9
5c
T. Hatsukade, K. P. Kuhl, E. R. Cave, D. N. Abram, T. F. Jaramillo, Phys. Chem. Chem. Phys. 2014, 16, 13814–13819.
CrossRef | PubMed | CAS | Web of Science® Times Cited: 46 | ADS
6
6a
W. Zhu, Y.-J. Zhang, H. Zhang, H. Lv, Q. Li, R. Michalsky, A. A. Peterson, S. Sun, J. Am. Chem. Soc. 2014, 136, 16132–16135;
CrossRef | PubMed | CAS | Web of Science® Times Cited: 52
6b
D. Kim, J. Resasco, Y. Yu, A. M. Asiri, P. Yang, Nat. Commun 2014, 5;
6c
W. Zhu, R. Michalsky, O. n. Metin, H. Lv, S. Guo, C. J. Wright, X. Sun, A. A. Peterson, S. Sun, J. Am. Chem. Soc. 2013, 135, 16833–16836;
CrossRef | PubMed | CAS | Web of Science® Times Cited: 115
6d
G. B. Stevens, T. Reda, B. Raguse, J. Electroanal. Chem. 2002, 526, 125–133.
CrossRef | CAS | Web of Science® Times Cited: 41
7
S. Ye, R. Wang, M. Z. Wu, Y. P. Yuan, Appl. Surf. Sci. 2015, 358, 15–27.
CrossRef | CAS | Web of Science® Times Cited: 21 | ADS
8
8a
Y. Hori, I. Takahashi, O. Koga, N. Hoshi, J. Phys. Chem. B 2002, 106, 15–17;
CrossRef | CAS | Web of Science® Times Cited: 84
8b
M. Gattrell, N. Gupta, A. Co, J. Electroanal. Chem. 2006, 594, 1–19.
CrossRef | CAS | Web of Science® Times Cited: 330
9
K. P. Kuhl, E. R. Cave, D. N. Abram, T. F. Jaramillo, Energy Environ. Sci. 2012, 5, 7050–7059.
CrossRef | CAS | Web of Science® Times Cited: 250
10
10a
A. M. Appel, J. E. Bercaw, A. B. Bocarsly, H. Dobbek, D. L. DuBois, M. Dupuis, J. G. Ferry, E. Fujita, R. Hille, P. J. Kenis, Chem. Rev. 2013, 113, 6621–6658;
CrossRef | PubMed | CAS | Web of Science® Times Cited: 274
10b
S. Ma, P. J. Kenis, Curr. Opin. Chem. Eng. 2013, 2, 191–199.
CrossRef | Web of Science® Times Cited: 69
11
K. Manthiram, B. J. Beberwyck, A. P. Alivisatos, J. Am. Chem. Soc. 2014, 136, 13319–13325.
CrossRef | PubMed | CAS | Web of Science® Times Cited: 42
12
D.-H. Lim, J. H. Jo, D. Y. Shin, J. Wilcox, H. C. Ham, S. W. Nam, Nanoscale 2014, 6, 5087–5092.
CrossRef | PubMed | CAS | Web of Science® Times Cited: 17 | ADS
13
13a
Y. Hori, A. Murata, R. Takahashi, S. Suzuki, J. Am. Chem. Soc. 1987, 109, 5022–5023;
CrossRef | CAS | Web of Science® Times Cited: 113
13b
J. Kim, D. Summers, K. Frese, J. Electroanal. Chem. Interf. Electrochem. 1988, 245, 223–244.
CrossRef | CAS | Web of Science® Times Cited: 94
14
C. W. Li, J. Ciston, M. W. Kanan, Nature 2014, 508, 504–507.
CrossRef | PubMed | CAS | Web of Science® Times Cited: 122 | ADS
15
L. B. Sheridan, D. K. Hensley, N. V. Lavrik, S. C. Smith, V. Schwartz, C. Liang, Z. Wu, H. M. Meyer, A. J. Rondinone, J. Electrochem. Soc. 2014, 161, H558-H563.
CrossRef | CAS | Web of Science®
16
M. Pourbaix, J. Electroanal. Chem. 1967, 13, 471-&.
17
A. A. Peterson, F. Abild-Pedersen, F. Studt, J. Rossmeisl, J. K. Norskov, Energy Environ. Sci. 2010, 3, 1311–1315.
CrossRef | CAS | Web of Science® Times Cited: 283
18
M. L. Perry, J. Newman, E. J. Cairns, J. Electrochem. Soc. 1998, 145, 5–15.
CrossRef | CAS | Web of Science® Times Cited: 222
19
J. H. Montoya, A. A. Peterson, J. K. Norskov, ChemCatChem 2013, 5, 737–742.
Wiley Online Library | CAS | Web of Science® Times Cited: 47
20
R. Kas, R. Kortlever, A. Milbrat, M. T. M. Koper, G. Mul, J. Baltrusaitis, Phys. Chem. Chem. Phys. 2014, 16, 12194–12201.
CrossRef | PubMed | CAS | Web of Science® Times Cited: 47 | ADS
21
F. Calle-Vallejo, M. T. M. Koper, Angew. Chem. Int. Edit. 2013, 52, 7282–7285.
Wiley Online Library | CAS | Web of Science® Times Cited: 51
22
22a
W. Tang, A. A. Peterson, A. S. Varela, Z. P. Jovanov, L. Bech, W. J. Durand, S. Dahl, J. K. Norskov, I. Chorkendorff, Phys. Chem. Chem. Phys. 2012, 14, 76–81;
CrossRef | PubMed | CAS | Web of Science® Times Cited: 108 | ADS
22b
I. Takahashi, O. Koga, N. Hoshi, Y. Hori, J. Electroanal. Chem. 2002, 533, 135–143.
CrossRef | CAS | Web of Science® Times Cited: 44
23
T. Kondo, Y. Honma, J. Oh, T. Machida, J. Nakamura, Phys. Rev. B 2010, 82, 153414.
CrossRef | CAS | Web of Science® Times Cited: 22 | ADS
24
24a
K. Gong, F. Du, Z. Xia, M. Durstock, L. Dai, Science 2009, 323, 760–764;
CrossRef | PubMed | CAS | Web of Science® Times Cited: 2287 | ADS
24b
L. Zhang, J. Niu, L. Dai, Z. Xia, Langmuir 2012, 28, 7542–7550;
CrossRef | PubMed | CAS | Web of Science® Times Cited: 93
24c
L. Zhang, Z. Xia, J. Phys. Chem. C 2011, 115, 11170–11176.
CrossRef | CAS | Web of Science® Times Cited: 403
25
25a
Z. W. Tang, H. Chen, X. W. Chen, L. M. Wu, X. B. Yu, J. Am. Chem. Soc. 2012, 134, 5464–5467;
CrossRef | PubMed | CAS | Web of Science® Times Cited: 53
25b
V. Schwartz, W. J. Fu, Y. T. Tsai, H. M. Meyer, A. J. Rondinone, J. H. Chen, Z. L. Wu, S. H. Overbury, C. D. Liang, ChemSusChem 2013, 6, 840–846;
Wiley Online Library | PubMed | CAS | Web of Science® Times Cited: 18
25c
G. K. P. Dathar, Y. T. Tsai, K. Gierszal, Y. Xu, C. D. Liang, A. J. Rondinone, S. H. Overbury, V. Schwartz, ChemSusChem 2014, 7, 483–491;
Wiley Online Library | PubMed | CAS | Web of Science® Times Cited: 23
25d
X. J. Cui, Y. H. Li, S. Bachmann, M. Scalone, A. E. Surkus, K. Junge, C. Topf, M. Beller, J. Am. Chem. Soc. 2015, 137, 10652–10658.
PubMed | Web of Science® Times Cited: 12
26
26a
L. B. da Silva, S. B. Fagan, R. Mota, Nano Lett. 2004, 4, 65–67;
CrossRef | CAS | Web of Science® Times Cited: 65 | ADS
26b
V. Tozzini, V. Pellegrini, J. Phys. Chem. C 2011, 115, 25523–25528.
CrossRef | CAS | Web of Science® Times Cited: 58
display math
where E0 is the equilibrium potential. By comparing Cu/CNS to control electrodes comprised of 1) Cu on glassy carbon and 2) bare CNS, we demonstrate that CO2 reduction activity is not a simple consequence of either Cu or CNS. While the reaction mechanism is not yet elucidated, we hypothesize an interaction between adjacent catalytic sites on the Cu and CNS, facilitated by the nanostructured morphology of the catalyst that prevents complete electrochemical reduction to ethylene or ethane, resulting in a high yield of ethanol.
Results and discussion
The bare CNS electrode (Supporting Information Figure?S1) was characterized in our previous study as a dense nanotextured carbon film terminated by randomly oriented nanospikes approximately 50–80?nm in length, where each nanospike consists of layers of puckered carbon ending in a ?2?nm wide curled tip.[15] The film is grown by a relatively simple direct-current plasma-enhanced chemical vapor deposition reaction using acetylene and ammonia as reagents.
The CNS film grows quickly and adheres well to the highly-doped silicon wafers that were used for this study. Raman spectra indicate that CNS have a similar structure to disordered, few-layer graphene.[15] The CNS is not crystalline and does not diffract. XPS indicates a nitrogen doping density of 5.1 ± 0.2?% atomic, with proportions of pyridinic, pyrrolic (or piperidinic) and graphitic nitrogens of 26, 25 and 37?% respectively, with the balance being oxidized N. In the current experiment, nanoparticles of Cu were electronucleated from CuSO4 solution directly onto the CNS (Supporting Information, Experimental Methods), and imaged via SEM shown in Figure?1. Electronucleation does not require templating surfactants to control the nanoparticle growth, and leaves the particle surfaces clean. The texture of the CNS promotes nucleation resulting in a large number of smaller particles, in comparison to the glassy carbon control which produced larger particles under identical conditions (Supporting Information Figure?S2), with a similar amount of Cu deposited. These well-dispersed Cu particles ranged from about 30?nm to 100?nm with average size of 39.18?nm, with a density ca. 2.21 × 10⁹ particles cm?2 (Figure?1B inset). According to the average particle size, the coverage of Cu on CNS is ca. 14.2?%. TEM measurements (Figure?2 inset) confirm particle size observed via SEM. High-resolution transmission electron microscopy on scraped samples (HR-TEM) shows the Cu/CNS interface (Figure?2 main) and illustrate a close proximity between Cu and CNS. The lattice spacing of this representative Cu nanoparticle was measured as 0.204?nm, which is consistent with Cu (111). Cu2O with lattice spacing ca. 0.235?nm were present on the Cu nanoparticles surface in this image, however due to the negative potential applied for Cu deposition, the oxide likely results from exposure to air during sample preparation and transportation between measurements.[16] The surface area of the textured surface of CNS and the glassy carbon was measured based on the double layer capacitance on both electrodes in 0.1?M KOH. Capacitance was measured by recording anodic-cathodic charging currents (in the potential region where Faradaic processes are absent; see Supporting Information Figure?S3). The active surface area of CuNPs was additionally measured by Pb underpotential deposition (Supporting Information) of a representative sample, but could not be measured for each sample without contamination. The Cu nanoparticles typically contribute approximately 8?% to the total electrode ECSA for the CNS. To measure the physical stability of the catalyst, SEM images were collected of the particles and the CNS cross sections before and after a 6-hour reduction experiment (Supporting Information Figures S4, S5).
Figure 1.
Figure 1. Open in figure viewerDownload Powerpoint slide
Representative SEM images of Cu/CNS electrode with (A) low and (B) high magnification. The average particle size is approximately 39?nm (C) as measured by automated particle sizing of the micrographs..
Figure 2.
Figure 2. Open in figure viewerDownload Powerpoint slide
HR-TEM of electrodeposited copper nanoparticles on carbon nanospike electrode. Electrodeposited particles are imbedded in N-doped carbon nanospikes providing intimate contact between copper surface and reactive sites in the carbon.
CO2 electroreduction activity was first measured by linear sweep voltammetry (LSV) in the potential range of ?0.00 to ?1.30?V vs. RHE at a sweep rate of 0.05?V s?1 as shown in Figure?3. In the presence of CO2-saturated potassium bicarbonate electrolyte, using the Cu/CNS, significant anodic shifts in the onset potential are observed compared to that under an argon atmosphere; the onset of activity in CO2 saturated electrolyte is ? 0.3?V more positive than in argon purged electrolyte. Note that unlike the featureless voltammograms obtained under an argon atmosphere, a subtle current plateau is obtained at ? ?0.9?V on electrodes with Cu nanoparticle in CO2 saturated electrolyte. But in the case of pristine CNS electrode, no activity towards CO2 reduction is observed except the onset of hydrogen evolution at much more negative potential. Larger current densities were obtained in Cu/CNS than either of the controls.
Figure 3.
Figure 3. Open in figure viewerDownload Powerpoint slide
LSV curves in potential range of 0.00 to ?1.30?V vs. RHE at a sweep rate of 0.05?V s?1 in 0.1?M KHCO3 under (A) argon and (B) CO2 atmosphere on pristine CNS (black), Cu/glassy carbon (red) and Cu/CNS (blue) electrodes. The current density is calculated using the electrochemical surface area (ECSA) of the electrode based on the double layer capacitance on CNS and glassy carbon electrodes in 0.1?M KOH, respectively..
Chronoamperometry (CA) measurements were conducted over a potential range from ?0.7 to ?1.3?V, which included these two reduction waves (representative data in Figure?4B for Cu/CNS and Supporting Information Figure S6?A for bare CNS and Cu/glassy carbon controls). New electrodes were fabricated for each data point. The gaseous and liquid products of each CA run were analyzed by gas chromatography (GC) and NMR (of headspace and electrolyte, respectively) to calculate overall current density and Faradaic efficiency for CO2 reduction and for each product. The overall sustained current density for CO2 reduction, JCO2 redn, increased with more negative potential (Supporting Information Figure?S6B) for all three electrodes, consistent with that shown in LSV curves. The Cu/CNS electrode had a greater propensity for CO2 reduction than either the Cu/glassy carbon or bare CNS electrodes; for instance, JCO2 redn from Cu/CNS was 5-fold higher than for bare CNS and 3-fold higher than for Cu/glassy carbon, at ?1.2?V.
Figure 4.
Figure 4. Open in figure viewerDownload Powerpoint slide
Fractional Faradaic efficiency of electrochemical reduction products at various potentials (A). The distribution of products indicates that up to ?0.9?V, only gas phase products are produced. At more negative potentials, the rate of CO production on the copper surface is high enough to allow CO dimerization to occur, producing C2 products and subsequently ethanol. Chronoamperometry on Cu/CNS at ?1.2?V (B) indicates that the electrode is stable although the distribution of products does change with time, beginning with a higher rate of H2 production which drops after the first 5000 seconds. Additional information including relative errors is available in Supporting Information Figure?S7.
The fractional Faradaic efficiency was computed by dividing the total electrons into each product (determined independently by chemical analysis) by the total electrons passed during the amperometry experiment. The fractional Faradaic efficiencies for Cu/CNS plus the controls at a range of potentials are shown in Figure?4?A, and for Cu/CNS at ?1.2?V over a 6-hour experiment in Figure?4B (Additional data including relative error for Cu/CNS are available in Supporting Information Figure?S7). Due to experimental losses between the anode and cathode, the total fractions are less than 100?%. The Cu/CNS electrode appears to be stable, as the current density and fractional Faradaic efficiencies for each product barely decreased over the 6?h experiment (Figure?4?A). No significant changes in the Cu nanoparticle size and or CNS thickness was observed from SEM (Figures S4, S5), indicating that the Cu/CNS is stable under these experimental conditions.
At ?0.9?V vs. RHE and more positive potential, only gas phase products H2, CO and CH4 were obtained from all three electrodes with CH4 as the major product Cu/CNS. In contrast, with bare CNS and Cu/glassy carbon, CO was the major product and the CO / CH4 ratio was almost independent of potential. The higher selectivity towards CH4 in Cu/CNS indicates a higher degree of surface-bound CO hydrogenation, which is a key step in the formation of CH4.[17] At ?1.0?V vs. RHE and more negative potential, the current density of CO2 reduction increased and ethanol was produced (as a liquid soluble in the aqueous electrolyte) only from Cu/CNS. In comparison, only CO and CH4 were produced from both control electrodes. At-1.3?V vs. RHE the Cu/glassy carbon also produced trace ethylene (representative GC traces, Supporting Information Figure?S8). GC and NMR analysis in search of other products more commonly produced by copper electroreduction, such as methanol or ethane only indicated (representative NMR, Supporting Information Figure?S9) occasional trace formate from Cu/CNS.
Examining the breakdown of Faradaic efficiencies for various reactions on Cu/CNS, reveals that at ?1.2?V (Figure?4?A), ethanol conversion exhibited the highest efficiency at 63?% (that is, 63?% of the electrons passing through the electrode were stored as ethanol). Also at ?1.2?V vs. RHE, the Faradaic efficiency of gas phase products methane and CO dropped to 6.8?% and 5.2?%, respectively. The Faradaic efficiency of CO2 reduction (competing against water reduction) is 75?%. This means that under the best conditions, the overall selectivity of the reduction mechanism for conversion of CO2 to ethanol is 84?%.
The partial current density and Faradaic efficiency of each product from Cu/CNS electrode at various potentials were illustrated in Figure?5. The partial current density and Faradaic efficiency for CO and methane exhibited a volcanic shape dependence to the potentials applied. The maximum total current density and Faradaic efficiency were observed at ?1.0?V vs. RHE, and decreased when ethanol generation began. The partial current density for ethanol generation increased dramatically with more negative potential until reaching ?1.2?V vs. RHE, where the maximum Faradaic efficiency for ethanol generation was also achieved. Above ?1.2?V vs. RHE, the rate of increase for ethanol current density was slower, consistent with CO2 mass transport limitations. Data were not collected above ?1.3?V vs. RHE because hydrogen bubbles that evolved from water reduction blocked the electrode. The decline of Faradaic efficiency for ethanol above ?1.2?V vs. RHE suggests that the catalyst reached the mass-transport-limited current density for CO2 reduction, and therefore hydrogen evolved via H2O reduction at unoccupied active sites.
Figure 5.
Figure 5. Open in figure viewerDownload Powerpoint slide
Partial current density (J, red) and Faradaic efficiency (FE, blue) of CO2 reduction products from Cu/CNS electrode at various potentials.
Previous reports of CO2 electroreduction on copper have demonstrated a variety of C1 and C2 products, including CO, CH4, CH2O2, ethane, ethylene, ethanol. Heavier hydrocarbons have not been reported as majority products.[9] Concerning the reaction mechanism, initial electron transfer to adsorbed CO2 will form CO2•?ads, which can be further reduced to COads or other C1 intermediates (CHOads or CH2Oads) with additional proton-electron transfer. CO will result from desorption of COads at this stage, or alternatively, further electron transfer to these surface-adsorbed species will lead to CH4.[1b, 13b] CO2 reduction results on the two controls, bare CNS and Cu nanoparticles on glassy carbon, indicate that both Cu metal and CNS are active for electrochemical CO2 reduction. On the Cu surface, stronger adsorption of CO exists than bare CNS, which provides stable intermediates for further reduction to CH4 on Cu/glassy carbon. In contrast, CO was released rather than reduced to CH4 on bare CNS.
Tafel plots (overpotential vs. the log of partial current density) for CO and CH4 are shown in Figure?6. For all three samples the plots are linear at low overpotential range with a slope that is consistent with a rate-determining initial electron transfer to CO2 to form a surface adsorbed CO2•? intermediate (120 mV / dec), a mechanism that is commonly invoked for metal electrocatalysts.[8b] At high overpotential range, steep slopes were obtained, probably indicating control by the combined effects of gas diffusion and ionic mass transport.[18] Comparing Cu/CNS to the control electrodes, a direct and intimate contact was introduced between Cu and CNS (Figure?2). Lim et?al. predicted a strong interaction between Cu nanoparticles and carbon, and we expect that to extend to CNS as well.[12] We expect that the strong interaction provides an environment in which a mechanism involving reactive sites on both the Cu surface and on the N-doped CNS may dominate.
Figure 6.
Figure 6. Open in figure viewerDownload Powerpoint slide
(A) CO and (B) CH4 partial current density Tafel plots.
The Cu/CNS catalyst is unusual because it primarily produces ethanol rather than methane or ethylene. Ethanol, as a C2 product, requires carbon-carbon coupling between surface-adsorbed intermediates at some point during the reduction reaction. Recent calculations on C?C coupling on Cu(211) surfaces suggest the kinetic barriers for the coupling are strongly influenced by the degree of the adsorbed CO hydrogenation.[19] These kinetic barriers tend to decrease with increasing degree of the surface bound CO hydrogenation, which can favor the C2 products from CO2 reduction.[20] A high percentage of C2 products would indicate that coupling is preferred to desorption and loss of C1 intermediates, and this preference for adsorption may be due to the nanostructured nature of the surface. Although initial CO2 reduction appears to be the rate-limiting step, the resulting intermediate must be stable enough to persist until a second intermediate is available for C2 coupling. The coupling may be between two surface-bound C1 intermediates, or between a surface-bound C1 intermediate and a nearby C1 intermediate in solution.[17, 21]
The maximum Faradaic efficiency of ethanol for Cu/CNS is reached at ?1.2?V vs. RHE. Further increase in overpotential (?1.3?V vs. RHE) increases Jethanol, but results in a lower Faradaic efficiency due to an increase in H2 production. Hence the proton and electron transfers to C1 become more favorable to produce CH4, which provides a competing pathway against C2 coupling. The details of the reaction mechanism are still to be determined at this time, however there are some lessons in the literature that may yield insights into the high selectivity of this catalyst. Ordinarily, on bulk copper the coupled C2 would continue to be reduced to ethylene or ethane so long as the product was in contact with the copper electrode.[8a, 22] In contrast, with this experiment we have not been able to detect any C2 product except ethanol using the Cu/CNS (ethylene was detected in the control sample Cu/glassy carbon), indicating that the dominant reaction mechanism precludes competitive reduction to ethylene or ethane. Kondo, et al. reported that the electronic structure near the Fermi level of graphene is modified in N-doped graphene, where localized ? electronic states are reported to form at the neighboring carbon atoms, and propagate anisotropically around the defect due to the perturbation of the ?-conjugated system.[23] Due to electron-withdrawing effects in the graphene ?-conjugated system, the carbon atoms adjacent to nitrogen are positively polarized. This polarization may provide an active site adjacent to the copper for the C2 intermediates to adsorb, which may inhibit complete electroreduction.[24] Other doped or defected graphenes are well known to be catalytically active for reactions such as dehydrogenation.[25]
First-principles density functional theory (DFT) calculations were carried out to investigate whether the nitrogen dopant or strongly curled morphology in the CNS can help to adsorb the C2 intermediates. As CNS has a similar structure to multilayer graphene, a graphene sheet is adopted to model the interaction between CNS and the C2 intermediates. The dimer of CO, OCCO, was chosen as a C2 intermediate candidate[19] for modeling of the interaction with CNS. For a pristine graphene sheet, our calculations suggest the binding energy between OCCO (through one oxygen atom) and graphene is 0.19?eV with a separation distance ?2.95?Å (Supporting Information Figure?S10?A). For N-doped graphene, the N dopant and adjacent carbon atoms become more active so that the binding energy with OCCO is increased to 0.64?eV with the separation distance shortened to ?2.70?Å (Supporting Information Figure?S10B). The tripling of the binding energy to 0.64?eV clearly indicates that the C2 intermediates, once formed, can be adsorbed by N-doped CNS fairly strongly and may not desorb easily at room temperature. Furthermore, it is important to note that CNS are puckered and curled, indicating local corrugation on the surface. It has been shown previously that local deformation or buckling could enhance the molecular adsorption on carbon nanotubes and graphene.[26] Here we also considered the buckling of pristine and N-doped graphene to investigate the local curvature effect on OCCO adsorption. Upon buckling, the binding energy between OCCO and the concave surface of pristine graphene is increased to 0.34?eV (Supporting Information Figure?S10C), while the binding energy between OCCO and the concave surface of N-doped graphene is enhanced to 0.74?eV (Supporting Information Figure?S10D). Therefore, the corrugation and curvature naturally embedded into CNS could also help to strengthen the binding between CNS and the C2 intermediates. In addition, we studied the interaction between OCCO and the copper surface, and found that a strong covalent binding is present (when the molecule approaches the Cu surface oriented with one end closer to the surface) with the separation distance reduced to ?1.98?Å and binding energy increased to ?1.21?eV (Supporting Information Figure?S11). Compared to this relatively strong covalent bond, the binding between OCCO and CNS is weaker, though strong enough to prevent easy desorption of the C2 intermediate. The calculations offer important insights into the observed selective reduction, and we expect that the oxygen atom on one end of the C2 intermediates is covalently bound on reactive copper surface for complete reduction to -CH3, while the oxygen atom on the other end of the C2 intermediates is adsorbed on less reactive CNS and thus protected from complete reduction (hence forming -CH2OH), thereby providing a pathway towards selective reduction to ethanol. The possibility that a synergistic effect between Cu and CNS is responsible for the selectivity is surprising given the large size of the Cu nanoparticles, however there is no doubt that the Cu is necessary for this reaction as bare CNS do not produce the same products. Likewise, Cu nanoparticles nucleated on glassy carbon (or any other copper reported to date) do not produce the same products without CNS. While the Cu particles are relatively large, they are on the scale of the CNS which are around 50?nm in length and tend to be imbedded within the spikes. A more detailed understanding of the reaction pathway of such selective reduction of CO2 to ethanol warrants further study.
Conclusion
We report an electrocatalyst which operates at room temperature and in water for the electroreduction of dissolved CO2 with high selectivity for ethanol. The overpotential (which might be lowered with the proper electrolyte, and by separating the hydrogen production to another catalyst) probably precludes economic viability for this catalyst, but the high selectivity for a 12-electron reaction suggests that nanostructured surfaces with multiple reactive sites in close proximity can yield novel reaction mechanisms. This suggests that the synergistic effect from interactions between Cu and CNS presents a novel strategy for designing highly selective electrocatalysts. While the entire reaction mechanism has not yet been elucidated, further details would be revealed from conversion of potential intermediates (e.?g. CO, formic acid and acetaldehyde) in future work.
Acknowledgements
This research was conducted at the Center for Nanophase Materials Sciences, which is a Department of Energy (DOE) Office of Science User Facility.
Ancillary
Supporting Information
1
1a
Y. Hori, K. Kikuchi, A. Murata, S. Suzuki, Chem. Lett. 1986, 15, 897–898;
CrossRef | Web of Science® Times Cited: 199
1b
Y. Hori, A. Murata, R. Takahashi, J. Chem. Soc., Faraday Trans. 1 1989, 85, 2309–2326;
CrossRef | CAS | Web of Science® Times Cited: 318
1c
D. W. DeWulf, T. Jin, A. J. Bard, J. Electrochem. Soc. 1989, 136, 1686–1691.
CrossRef | CAS | Web of Science® Times Cited: 129
2
2a
Y. Tomita, S. Teruya, O. Koga, Y. Hori, J. Electrochem. Soc. 2000, 147, 4164–4167;
CrossRef | CAS | Web of Science® Times Cited: 43
2b
M. Z. Ertem, S. J. Konezny, C. M. Araujo, V. S. Batista, J. Phys. Chem. Lett. 2013, 4, 745–748;
CrossRef | PubMed | CAS | Web of Science® Times Cited: 56
2c
R. Kortlever, I. Peters, S. Koper, M. T. Koper, ACS Catal. 2015.
3
3a
C. Costentin, S. Drouet, M. Robert, J.-M. Savéant, Science 2012, 338, 90–94;
CrossRef | PubMed | CAS | Web of Science® Times Cited: 166 | ADS
3b
C. Costentin, G. Passard, M. Robert, J.-M. Savéant, J. Am. Chem. Soc. 2014, 136, 11821–11829.
CrossRef | PubMed | CAS | Web of Science® Times Cited: 31
4
Y. Wang, J. Zhou, W. X. Lv, H. L. Fang, W. Wang, Appl. Surf. Sci. 2016, 362, 394–398.
CrossRef | CAS | Web of Science® | ADS
5
5a
C. E. Tornow, M. R. Thorson, S. Ma, A. A. Gewirth, P. J. Kenis, J. Am. Chem. Soc. 2012, 134, 19520–19523;
CrossRef | PubMed | CAS | Web of Science® Times Cited: 47
5b
J. Rosen, G. S. Hutchings, Q. Lu, S. Rivera, Y. Zhou, D. G. Vlachos, F. Jiao, ACS Catal. 2015, 5, 4293–4299;
CrossRef | CAS | Web of Science® Times Cited: 9
5c
T. Hatsukade, K. P. Kuhl, E. R. Cave, D. N. Abram, T. F. Jaramillo, Phys. Chem. Chem. Phys. 2014, 16, 13814–13819.
CrossRef | PubMed | CAS | Web of Science® Times Cited: 46 | ADS
6
6a
W. Zhu, Y.-J. Zhang, H. Zhang, H. Lv, Q. Li, R. Michalsky, A. A. Peterson, S. Sun, J. Am. Chem. Soc. 2014, 136, 16132–16135;
CrossRef | PubMed | CAS | Web of Science® Times Cited: 52
6b
D. Kim, J. Resasco, Y. Yu, A. M. Asiri, P. Yang, Nat. Commun 2014, 5;
6c
W. Zhu, R. Michalsky, O. n. Metin, H. Lv, S. Guo, C. J. Wright, X. Sun, A. A. Peterson, S. Sun, J. Am. Chem. Soc. 2013, 135, 16833–16836;
CrossRef | PubMed | CAS | Web of Science® Times Cited: 115
6d
G. B. Stevens, T. Reda, B. Raguse, J. Electroanal. Chem. 2002, 526, 125–133.
CrossRef | CAS | Web of Science® Times Cited: 41
7
S. Ye, R. Wang, M. Z. Wu, Y. P. Yuan, Appl. Surf. Sci. 2015, 358, 15–27.
CrossRef | CAS | Web of Science® Times Cited: 21 | ADS
8
8a
Y. Hori, I. Takahashi, O. Koga, N. Hoshi, J. Phys. Chem. B 2002, 106, 15–17;
CrossRef | CAS | Web of Science® Times Cited: 84
8b
M. Gattrell, N. Gupta, A. Co, J. Electroanal. Chem. 2006, 594, 1–19.
CrossRef | CAS | Web of Science® Times Cited: 330
9
K. P. Kuhl, E. R. Cave, D. N. Abram, T. F. Jaramillo, Energy Environ. Sci. 2012, 5, 7050–7059.
CrossRef | CAS | Web of Science® Times Cited: 250
10
10a
A. M. Appel, J. E. Bercaw, A. B. Bocarsly, H. Dobbek, D. L. DuBois, M. Dupuis, J. G. Ferry, E. Fujita, R. Hille, P. J. Kenis, Chem. Rev. 2013, 113, 6621–6658;
CrossRef | PubMed | CAS | Web of Science® Times Cited: 274
10b
S. Ma, P. J. Kenis, Curr. Opin. Chem. Eng. 2013, 2, 191–199.
CrossRef | Web of Science® Times Cited: 69
11
K. Manthiram, B. J. Beberwyck, A. P. Alivisatos, J. Am. Chem. Soc. 2014, 136, 13319–13325.
CrossRef | PubMed | CAS | Web of Science® Times Cited: 42
12
D.-H. Lim, J. H. Jo, D. Y. Shin, J. Wilcox, H. C. Ham, S. W. Nam, Nanoscale 2014, 6, 5087–5092.
CrossRef | PubMed | CAS | Web of Science® Times Cited: 17 | ADS
13
13a
Y. Hori, A. Murata, R. Takahashi, S. Suzuki, J. Am. Chem. Soc. 1987, 109, 5022–5023;
CrossRef | CAS | Web of Science® Times Cited: 113
13b
J. Kim, D. Summers, K. Frese, J. Electroanal. Chem. Interf. Electrochem. 1988, 245, 223–244.
CrossRef | CAS | Web of Science® Times Cited: 94
14
C. W. Li, J. Ciston, M. W. Kanan, Nature 2014, 508, 504–507.
CrossRef | PubMed | CAS | Web of Science® Times Cited: 122 | ADS
15
L. B. Sheridan, D. K. Hensley, N. V. Lavrik, S. C. Smith, V. Schwartz, C. Liang, Z. Wu, H. M. Meyer, A. J. Rondinone, J. Electrochem. Soc. 2014, 161, H558-H563.
CrossRef | CAS | Web of Science®
16
M. Pourbaix, J. Electroanal. Chem. 1967, 13, 471-&.
17
A. A. Peterson, F. Abild-Pedersen, F. Studt, J. Rossmeisl, J. K. Norskov, Energy Environ. Sci. 2010, 3, 1311–1315.
CrossRef | CAS | Web of Science® Times Cited: 283
18
M. L. Perry, J. Newman, E. J. Cairns, J. Electrochem. Soc. 1998, 145, 5–15.
CrossRef | CAS | Web of Science® Times Cited: 222
19
J. H. Montoya, A. A. Peterson, J. K. Norskov, ChemCatChem 2013, 5, 737–742.
Wiley Online Library | CAS | Web of Science® Times Cited: 47
20
R. Kas, R. Kortlever, A. Milbrat, M. T. M. Koper, G. Mul, J. Baltrusaitis, Phys. Chem. Chem. Phys. 2014, 16, 12194–12201.
CrossRef | PubMed | CAS | Web of Science® Times Cited: 47 | ADS
21
F. Calle-Vallejo, M. T. M. Koper, Angew. Chem. Int. Edit. 2013, 52, 7282–7285.
Wiley Online Library | CAS | Web of Science® Times Cited: 51
22
22a
W. Tang, A. A. Peterson, A. S. Varela, Z. P. Jovanov, L. Bech, W. J. Durand, S. Dahl, J. K. Norskov, I. Chorkendorff, Phys. Chem. Chem. Phys. 2012, 14, 76–81;
CrossRef | PubMed | CAS | Web of Science® Times Cited: 108 | ADS
22b
I. Takahashi, O. Koga, N. Hoshi, Y. Hori, J. Electroanal. Chem. 2002, 533, 135–143.
CrossRef | CAS | Web of Science® Times Cited: 44
23
T. Kondo, Y. Honma, J. Oh, T. Machida, J. Nakamura, Phys. Rev. B 2010, 82, 153414.
CrossRef | CAS | Web of Science® Times Cited: 22 | ADS
24
24a
K. Gong, F. Du, Z. Xia, M. Durstock, L. Dai, Science 2009, 323, 760–764;
CrossRef | PubMed | CAS | Web of Science® Times Cited: 2287 | ADS
24b
L. Zhang, J. Niu, L. Dai, Z. Xia, Langmuir 2012, 28, 7542–7550;
CrossRef | PubMed | CAS | Web of Science® Times Cited: 93
24c
L. Zhang, Z. Xia, J. Phys. Chem. C 2011, 115, 11170–11176.
CrossRef | CAS | Web of Science® Times Cited: 403
25
25a
Z. W. Tang, H. Chen, X. W. Chen, L. M. Wu, X. B. Yu, J. Am. Chem. Soc. 2012, 134, 5464–5467;
CrossRef | PubMed | CAS | Web of Science® Times Cited: 53
25b
V. Schwartz, W. J. Fu, Y. T. Tsai, H. M. Meyer, A. J. Rondinone, J. H. Chen, Z. L. Wu, S. H. Overbury, C. D. Liang, ChemSusChem 2013, 6, 840–846;
Wiley Online Library | PubMed | CAS | Web of Science® Times Cited: 18
25c
G. K. P. Dathar, Y. T. Tsai, K. Gierszal, Y. Xu, C. D. Liang, A. J. Rondinone, S. H. Overbury, V. Schwartz, ChemSusChem 2014, 7, 483–491;
Wiley Online Library | PubMed | CAS | Web of Science® Times Cited: 23
25d
X. J. Cui, Y. H. Li, S. Bachmann, M. Scalone, A. E. Surkus, K. Junge, C. Topf, M. Beller, J. Am. Chem. Soc. 2015, 137, 10652–10658.
PubMed | Web of Science® Times Cited: 12
26
26a
L. B. da Silva, S. B. Fagan, R. Mota, Nano Lett. 2004, 4, 65–67;
CrossRef | CAS | Web of Science® Times Cited: 65 | ADS
26b
V. Tozzini, V. Pellegrini, J. Phys. Chem. C 2011, 115, 25523–25528.
CrossRef | CAS | Web of Science® Times Cited: 58